Disaster Prevention in a Gulfstream
Earthquakes, volcanoes, mudslides: Airborne radar watches all the ways the earth moves.
/https://tf-cmsv2-smithsonianmag-media.s3.amazonaws.com/filer/3a/91/3a91583e-2b5b-4b6a-8911-98328d514e92/07f_sep2015_imagesecuadorpia16942_live.jpg)
In his three decades in the U.S. Air Force and as a NASA test pilot, Troy Asher has flown to the North Pole and to Antarctica, and most places in between. Now he regularly hopscotches across North, Central, and South America in a Gulfstream jet for weeks at a time collecting scientific data that is sought after by researchers across the entire Earth studies spectrum.
Asher, who is now at NASA’s Armstrong Flight Research Center in Edwards, California, was flying with a radar instrument that measures tiny changes in the land below. With the pilot following the same flight path precisely again and again, the radar gathers information about how earthquakes, volcanoes, floods, and other natural hazards change the landscape. On a recent South American deployment, it explored dangerous sinkholes, huge tropical rivers, and restless volcanoes. “There’s one in Nicaragua that always has a nice plume of smoke,” Asher says. “We go to some pretty neat places.”
The radar is providing a new way to understand natural disasters—and help prevent the destruction they can cause. Scientists have used it to discover how the ground shifted after a major 2010 earthquake in Baja California, Mexico, how a hillside in Colorado is creeping forward in a slow-motion landslide, and where aging levees might be failing along California’s Sacramento River. “It’s amazing, all the different things that people are working on using data from the same sensor,” says Bruce Chapman, a radar scientist at NASA’s Jet Propulsion Laboratory in Pasadena, California.
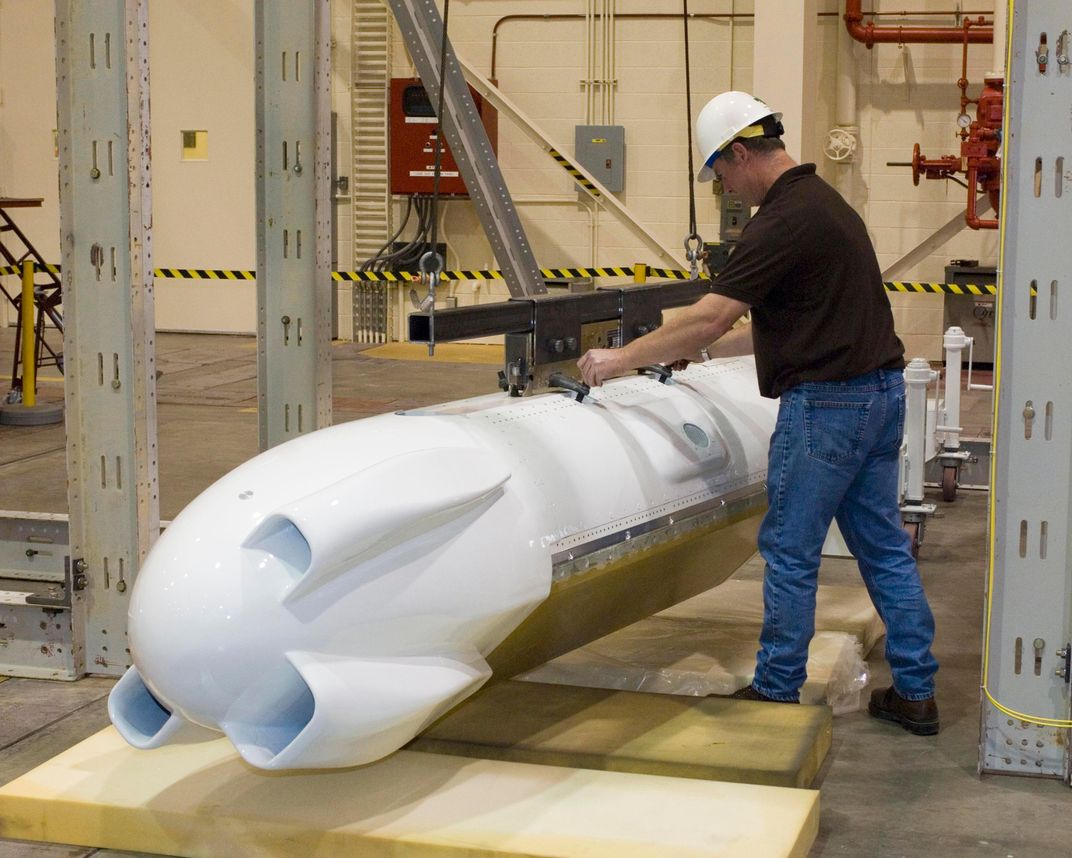
Technically the instrument is known by the clunky acronym UAVSAR, for Uninhabited Aerial Vehicle Synthetic Aperture Radar. It was originally envisioned to fly aboard a drone, but the Federal Aviation Administration forbids drones from flying at the required altitude over populated areas. That prohibition would have eliminated too many areas of interest, but the name stuck.
For decades, researchers have used satellites to bounce radio waves off the ground and measure the speed of their return. Unlike other remote-sensing imaging technologies, radar works even when it is cloudy. NASA operated a series of radar experiments aboard the space shuttle, culminating in the Shuttle Radar Topography Mission in 2000; scientists still rely on its data.
But radar in space is at such a distance that many details are lost. By putting an instrument aboard an airplane, scientists get much sharper imagery, at resolutions of just four feet per pixel, compared to around 10 feet or greater for most satellites. They can also fly the airplane to a target—say, an erupting volcano—and study it when they need to, rather than waiting for a satellite to pass overhead. Perhaps more importantly, airborne radar enables scientists to fly the exact same flight track over a target weeks, months, or even years later. Researchers can use a technique called interferometry to combine the before and after images in order to map where the ground has shifted—changes measuring less than a centimeter—between the two flights.
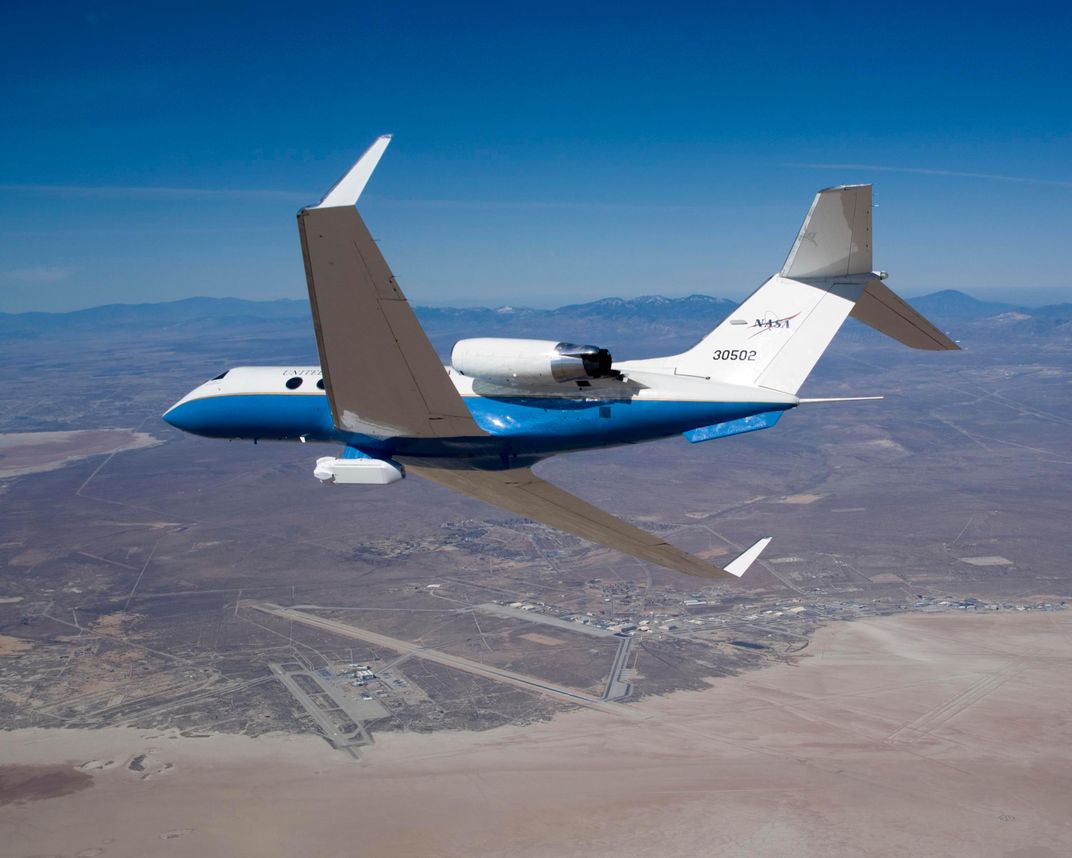

This requires precision flying. The instrument is mounted on the belly of a modified Gulfstream III jet, a model C-20A that NASA acquired from the Air Force in 2003. The airplane has to fly a path to an accuracy of within 5 meters (16 feet) for about 20 minutes. To make this happen, NASA engineers developed a precision autopilot system. Essentially, the airplane is told to aim for a narrow ring in the sky, about 30 meters across. “You have to find that ring and fly through it,” Asher says. “From a pilot’s standpoint it’s not natural.” Once the aircraft is lined up properly, the autopilot system engages.
After the Earthquake
The main radar is housed at NASA’s Armstrong base in Palmdale, so it’s easy to use the instrument to routinely survey the network of faults that crisscross California. (A second instrument, which uses radar of a different wavelength, is based at NASA’s Johnson Space Center in Houston.) The California radar measures the ground along most of the San Andreas fault about every six months. Andrea Donnellan, a geophysicist at JPL, says that between passes, scientists can see where the ground has deformed since the last trip, and what that might be saying about geological strain building up within the earth. The San Andreas is peppered with seismometers and global positioning stations to measure such changes down on the ground, but the airborne radar provides broader and more regional perspectives.
Those surveys came in handy after April 4, 2010, when a magnitude-7.2 earthquake shook parts of southern California. Donnellan had her pre-quake images in hand and got the radar in the air to gather new images. Together, they revealed big swaths where the ground was continuing to shift by several centimeters—long after the quake had finished. Only radar interferometry could have unveiled this change in this kind of detail, Donnellan says.
Such findings, showing where the ground is most likely to shift, could help emergency planners prepare better and help civil engineers build more appropriate structures in fault zones. Some earthquake damage may come not from the shaking of the quake itself, Donnellan says, but rather this recently discovered slip that happens later. She had another chance to test her ideas on August 24, 2014, when a magnitude-6.0 earthquake struck Napa Valley in northern California. Among the damage were two cracked runways at the county airport, possibly because of later slip. Five days after the main shock hit, UAVSAR flew over the region to help disaster managers assess whether levees and aqueducts had been damaged. The radar images helped guide teams to sites of potential weakness that might need to be fixed.
For JPL engineer Cathleen Jones, the system is a way to look for trouble spots before they become even bigger trouble. Jones helped test the instrument as it was being built in the late 2000s, and spent a lot of time flying over the San Andreas and other faults in the San Francisco Bay Area. That meant many hours looking down on the Sacramento River, which drains from the Sierra Nevada mountains toward the city. “I just started reading and learned that this area is the most critical water resource for the state,” she says. More than 1,100 miles of earthen levees control the water flow, but many are more than a century old and are subsiding. “A break in the levees is could draw saltwater back in from the San Francisco Bay and contaminate the water supply for 23 million people,” Jones says.
Now she flies radar over the levees about every six weeks, looking for parts that are sinking. When she spots weak places, she calls a state engineer, who evaluates the situation. Jones has started doing the same thing for levees around New Orleans; any time the California UAVSAR airplane, which uses the necessary radar wavelength for this target, happens to be near the Gulf Coast it collects data that she uses to monitor the levees.
Louisiana holds a special attraction for Jones, who grew up in the city of Lake Charles. When an ecologist colleague called to ask if she could help map the extent of the devastation of the April 2010 Deepwater Horizon oil spill, she jumped at the opportunity, scrambling to get approval from NASA and then heading east in the UAVSAR airplane, which flew over the oil slick and the nearby coastlines for 14 hours.
Scientists can’t do radar interferometry over the ocean, because churning waves create too much noise in the data, making it impossible to analyze changes from one pass to the next. But with a series of one-time passes over the oil slick, Jones and her colleagues were able to tease out where the oil was the most dense and where it had been broken up into an oil-water slurry. “It actually clearly showed the signatures of different densities of oil within that slick,” she says.
In western Colorado, the U.S. Geological Survey has spent decades watching a landslide called Slumgullion. Above the town of Lake City, a mass of earth about four miles long is slowly slipping downhill; toward the center of the slide, the ground is moving more than half an inch a day.
Radar interferometry shows how portions of the slide move faster than others—for instance, in the spring, when the snow melts and water lubricates its movement, says JPL geophysicist Eric Fielding. With airborne radar, “we can get a complete map of the whole three-dimensional motion,” he says. Understanding that kind of earth movement could help geologists better prepare for other, faster landslides, such as the massive one in Grand Mesa, Colorado, which killed three people last year.
Lavaland
The Gulfstream research jet has traveled much of the Pacific’s “ring of fire”—from the southern tip of South America, along the western United States up to Alaska, and across to Japan—gathering data on more than 100 volcanoes, some recently active and some thought to be long dormant.
“Volcanoes are basically fun,” says JPL’s Paul Lundgren, the principle investigator for the UAVSAR volcanoes program. Unlike scattered, ground-based instruments such as seismometers or GPS stations, radar can watch an entire volcano change shape over time.
Often before a volcano erupts, its flanks rise upward, as if the mountain is taking a deep breath. The amount of deformation sometimes signals how much magma is building up beneath the volcano. But sometimes volcanoes show a lot of deformation and never erupt, Lundgren says. Others erupt with no change in shape. Having radar data on as many volcanoes as possible, he says, helps scientists recognize better patterns they can use in predicting what happens in future eruptions.
Lundgren dreams of being able to fly the radar near an actively erupting volcano so he can watch it deforming in near real-time. “If you had a Mount St. Helens scenario, you could fly daily or even hourly,” he says. But for now, he is watching and waiting, collecting as much data as he can. That includes images of the Copahue volcano between Argentina and Chile, which has been erupting on and off since late 2012. Farther north in the Andes, at the Laguna del Maule volcanic complex, Lundgren and others have measured about six inches of ground changes over the past year. For now, the scientists aren’t sure whether the changes signal that an eruption is on the way—but if it does go off, Lundgren and the UAVSAR will be ready.
Lundgren used the recent South American deployment as a chance to add new radar images of previously unmeasured volcanoes to his collection. On the same trip, Chapman used the radar to measure floods on a tributary of the Amazon River; the imagery reveals patterns of carbon cycling in tropical forests. And Jones used it to capture another round of data on sinkholes and levees along the Louisiana coast.
The trip underscored just how multifaceted the airborne radar is—giving scientists a fresh glimpse at the hazards facing the planet.