How Much Water Is on the Moon?
What we know, how we know it, and what we still need to know.
/https://tf-cmsv2-smithsonianmag-media.s3.amazonaws.com/accounts/headshot/blog_headshot_spudis-300x300.jpg)
/https://tf-cmsv2-smithsonianmag-media.s3.amazonaws.com/filer/81/5f/815f9736-3f19-4eb5-a6af-8b61b6839dbc/psr-image.jpg)
Judging from news articles and comment sections where America’s renewed “return to the Moon” policy is discussed, there is a lot of misunderstanding surrounding the important issue of lunar polar water. Much of this confusion stems from a lack of familiarity with the types of remote sensing used to make water measurements, and from the uncertainties and our (quite significant) remaining ignorance of the physical conditions of the lunar poles.
The short answer to the question posed in the title is: We’re not sure. True, there is a great mass of evidence for the existence of water ice in the polar regions of the Moon but the identification and estimates of this water vary in certainty, precision, location and abundance. In an attempt to make things clearer, I’ll briefly describe what the principal data sets tell us, along with their drawbacks and uncertainties (starting with the least ambiguous measurements, then moving on to those of increasing uncertainty), before concluding with what we still need to do to refine our knowledge.
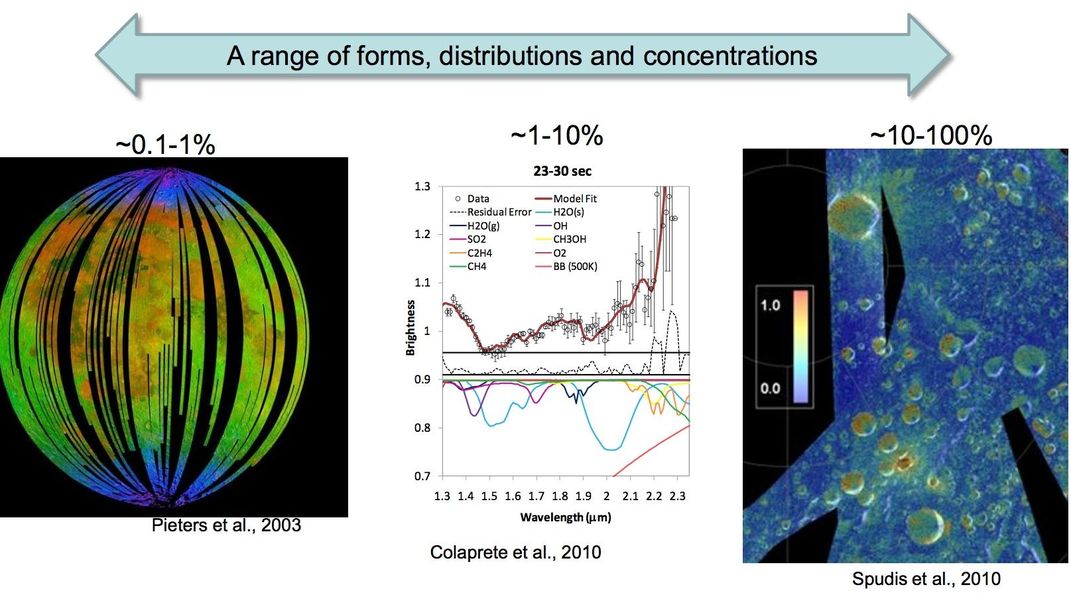
The LCROSS impact. On October 9, 2009, the empty Centaur upper stage of the Lunar Reconnaissance Orbiter (LRO) launch vehicle was deliberately slammed into the floor of Cabeus crater, near the south pole of the Moon. The cloud of debris resulting from this impact was observed by both the satellite following it (which then itself hit the Moon) and by the orbiting LRO spacecraft. The satellite observed the interactions of sunlight with the ejecta plume and measured the absorptions of that light in the near infrared. Both water vapor and water ice (H2O) particles were detected, along with a variety of minor components, including carbon monoxide (CO), ammonia (NH3), methane (CH4) and some simple organic (carbon-bearing) molecules. The spectra from the LCROSS infrared observations indicate an abundance of about 5.6 ± 2.9 percent by weight (wt.%) of water. In contrast to widespread belief, this estimate is still valid eight years after the event, and has not been adjusted.
Adjustments have been made to estimates of ejected volatiles from the Lyman Alpha Mapping Project (LAMP) experiment on LRO. LAMP is a far ultraviolet spectrometer, operating largely in the wavelength range of 100-200 nm. LAMP found clear evidence for a variety of elements and two molecules—CO and H2 (not water, but molecular hydrogen)—in the ejecta. Because we have much less operational experience with interpreting UV fluorescence data than we do for near IR absorption spectra on the Moon, the results published by the LAMP team were corrected a year after initial publication. The new estimates lowered the quantities of elements present in the LCROSS ejecta plume by a factor of 5.47—for all species except H2, which increased from 1.4 wt.% in the preliminary analysis to 3.7 wt.% in the refined estimate. To give some perspective, the global mean concentration of hydrogen in the lunar soil is about 50 parts per million (or 0.005 wt.%), so in the LCROSS ejecta, hydrogen is enriched over non-polar lunar soils by a factor of 740.
Water, in the form of vapor and small particles, and molecular hydrogen were all released by the LCROSS impact. It is likely that significant hydrogen is present in both atomic and molecular (H2, OH, H2O) forms in the polar craters. Near IR and far UV spectra suggest abundances at the 2-10 wt.% levels; this ejecta comes from depths of 2-5 meters.
Neutron spectrometry. This technique measures the quantity and energy of neutrons. Neutrons are produced in galactic space and interact with the lunar surface where medium energy neutrons are strongly absorbed by hydrogen atoms. Thus, if we see a low flux of such neutrons while flying over the Moon, we infer the presence of excess hydrogen there. Neutron mapping only detects hydrogen—it does not tell us in what form the hydrogen occurs (atomic, molecular, or mineral-bound).
Both the Lunar Prospector mission of 1998 and the current LRO mission carried a neutron spectrometer. Both missions found elevated amounts of hydrogen at both poles, with an average enhancement of about 150 parts per million (compared to 50 ppm in normal soils) over latitudes poleward of 80°. Neutron spectrometers have an omnidirectional field of view, and the surface resolution of a neutron instrument is roughly equal to its altitude above the Moon (30-50 kilometers in this case). Thus, we cannot see any feature smaller than about 30-50 km in these maps. If we assume that the neutron signal is from hydrogen in water ice, and that such ice is only stable in the permanently dark craters there, the neutron data suggest that the average water abundance in these craters is about 1.5 wt.%. Again, this estimate does not preclude the presence of higher concentrations in some craters, as no single dark interior is resolvable with existing neutron data. Moreover, the neutron signal originates only from the upper meter of the lunar surface, meaning that it cannot determine hydrogen presence or concentration at depths greater than this.
Radar. The discovery of water near the south pole of the Moon was a legacy of the Clementine mission in 1994 (paper published in 1996). Radar does not directly sense water, but its reflection properties are used to detect material transparent at radio frequencies (RF). When polarized RF waves are sent to a normal planetary surface, right-circular polarized RF returns to the antenna as left-circular polarized waves. The ratio of the received power in “same sense” transmitted to the “opposite sense” transmitted is called the circular polarization ratio (CPR). Normal lunar surfaces have CPR less than one (i.e., more opposite sense than same sense are reflected). However, two kinds of targets produce high CPR—extremely rough, rocky surfaces and water ice. An example of the former might be a very young, fresh impact crater, which produces an ejecta blanket of rough, angular rocks (e.g., Tycho). Examples of water ice are the surfaces of the icy satellites of Jupiter (Europe, Ganymede and Callisto) and the fill of polar craters on Mercury—each thought to be predominantly composed of water ice.
Clementine found high CPR during its pass over the lunar south pole. However, because of the ambiguity of what CPR indicates, this result was not universally accepted as evidence for the presence of water ice. In 2008, India’s Chandrayaan-1 orbited the Moon carrying Mini-SAR (an imaging radar designed to map the lunar poles). It found evidence of anomalous craters at both poles with high CPR in their interiors (in permanent darkness) but low CPR on their rims (which were in partial sunlight). This result meant that the dark crater floors (cold-traps) could contain water ice, probably at concentration levels of several tens of percent. Similar results were obtained with an advanced version of this radar (Mini-RF) on the American LRO mission.
Imaging radar on both Chandrayaan and LRO were monostatic, meaning that the transmitter illuminating the dark crater interiors is co-located with the receiver. Thus, these images are always looking at zero-phase (line-of-sight). If we could look off zero phase (i.e., transmit from one place and receive at another, a technique called bistatic radar) we could measure the dependence of CPR on the phase angle. Rock and ice targets have a very different response as a function of angle; rocky surfaces have pretty much the same enhancement regardless of phase, whereas ice displays a sharp, narrow (few degrees) peak centered on zero.
One of the reasons we interpreted the Clementine data (which was bistatic—transmitted from the spacecraft and received on Earth) as indicating ice was its narrow peak of enhanced CPR around the zero phase point. Recently, the Mini-RF on LRO conducted bistatic measurements of Cabeus crater (the location of the 2009 LCROSS impact). The giant radio dish at Arecibo, Puerto Rico was used as a transmitter, and echoes were received onboard the LRO spacecraft. The results from Cabeus bistatic imaging show a strongly peaked response curve, similar to the 1994 Clementine result and indicative of the presence of significant deposits of ice, possibly at concentrations of several tens of weight percent. Radar samples depths of ~10-20 wavelengths, depending on regolith density. Both Clementine and Mini-RF used S-band (~2380 MHz or 12.6 cm wavelength) RF, and thus, sampled the upper 2-3 meters of the lunar surface.
Laser and UV reflectance. Both the laser altimeter (LOLA) and LAMP on LRO could “see” into the dark polar craters, the former by illuminating the dark regions with its laser pulse and the latter by using galactic Lyman-a UV to image the crater interiors. Both found evidence for water “frost” in some locations near the pole. LOLA found that the floors of polar dark craters are slightly but distinctly “brighter” (higher albedo) than other crater interiors, interpreted as indicative of the presence of water frost. Direct observations of high-UV albedo frost in craters near the south pole were obtained from LAMP observations. Both these techniques sample only the uppermost micron or so of the surface, and so cannot account for abundances greater than a few tenths of a percent.
Near-IR spectra. Data from three spacecraft (Chandrayaan-1, Cassini, and EPOXI) in 2009 found an absorption around 3 microns (3000 nm) on the lunar surface that begins around 60° latitude and increases in strength towards the pole. This spectral band is caused by hydroxyl (OH) and water (H2O). The absorption is widespread over this region of the Moon (millions of square kilometers) and although only derived from the uppermost micron of the surface, could potentially be the largest reservoir of water on the Moon. Moreover, this material is spatially variable in concentration and temporally variable with the time of day, being stronger in the cooler early morning and late afternoon, local time. The concentrations of this water are unclear, but ~1000 ppm (0.01 wt.%) is a reasonable estimate.
Synthesis. So how much water is at the lunar poles? We don’t have an exact answer yet, but from looking at the amounts sensed at each pole (and accounting for the technique and how deep it samples), I estimate that between 100 million and one billion metric tons of water are present at each pole. The actual quantities of ice at a given site, its physical state, depth of burial and other properties still need to be determined. Although more orbital measurements would be valuable, it is most critical to get instruments down on the surface of the Moon next, at the poles, in order to make detailed site surveys—information crucial to formulating good engineering decisions about where to place the lunar outpost(s) and how to go about harvesting the Moon’s water for the creation of new capabilities in spacefaring and settlement.
/https://tf-cmsv2-smithsonianmag-media.s3.amazonaws.com/accounts/headshot/blog_headshot_spudis-300x300.jpg)