As the Earth Melts
Scientists try to fathom what remains beneath the tip of the iceberg.
/https://tf-cmsv2-smithsonianmag-media.s3.amazonaws.com/filer/a1/9c/a19cc055-aeff-4f70-846a-6491411cd01f/13p_on2017_option1_706324main_20121112_live.jpg)
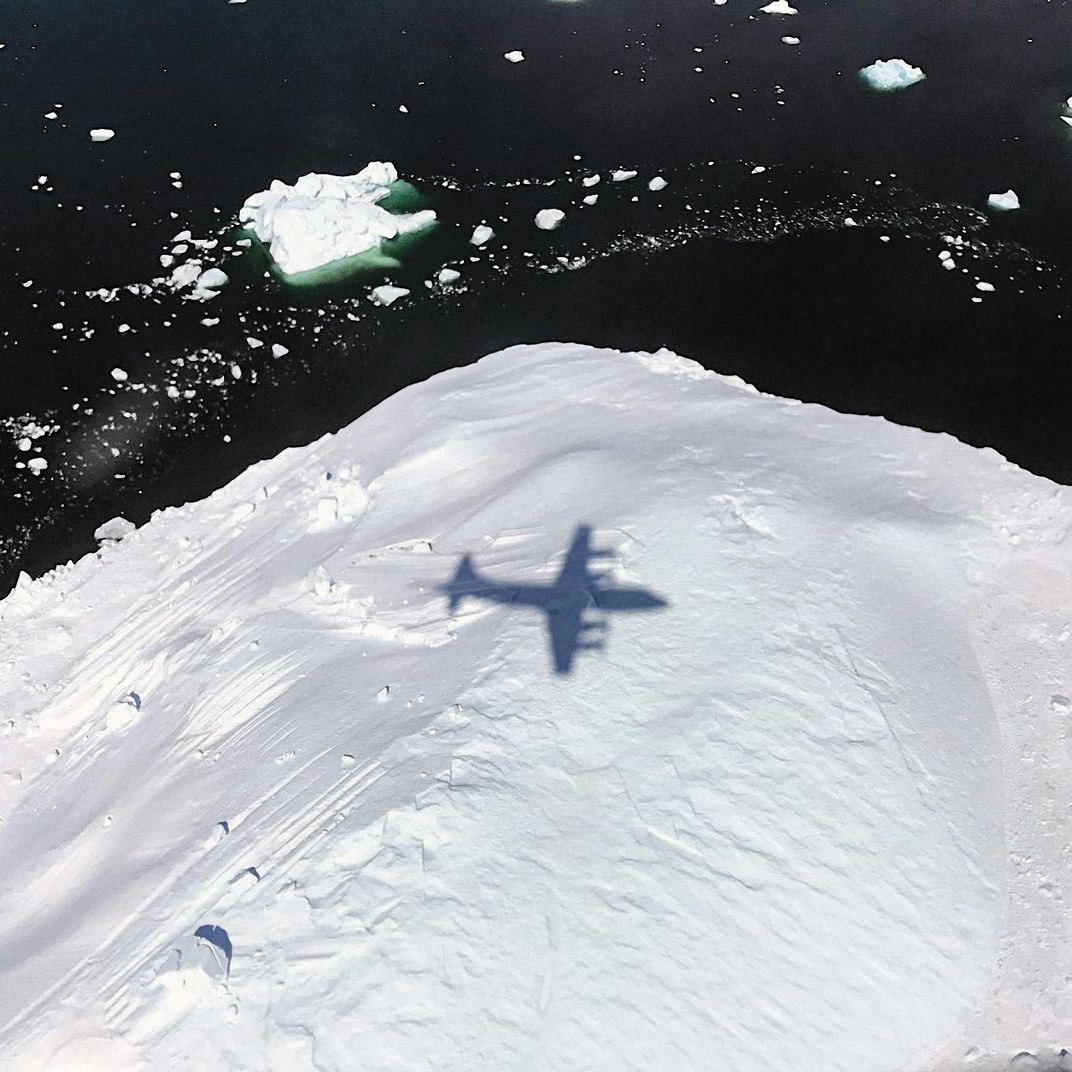
ABOVE THE NORTHEAST GREENLAND ICE STREAM—Seen from the window of a Lockheed P-3 Orion turboprop flying at 1,500 feet, Greenland’s ice seems to go on forever. It stretches to the horizon in all directions, an immensity of shimmering white. We fly for hours and the landscape barely changes.
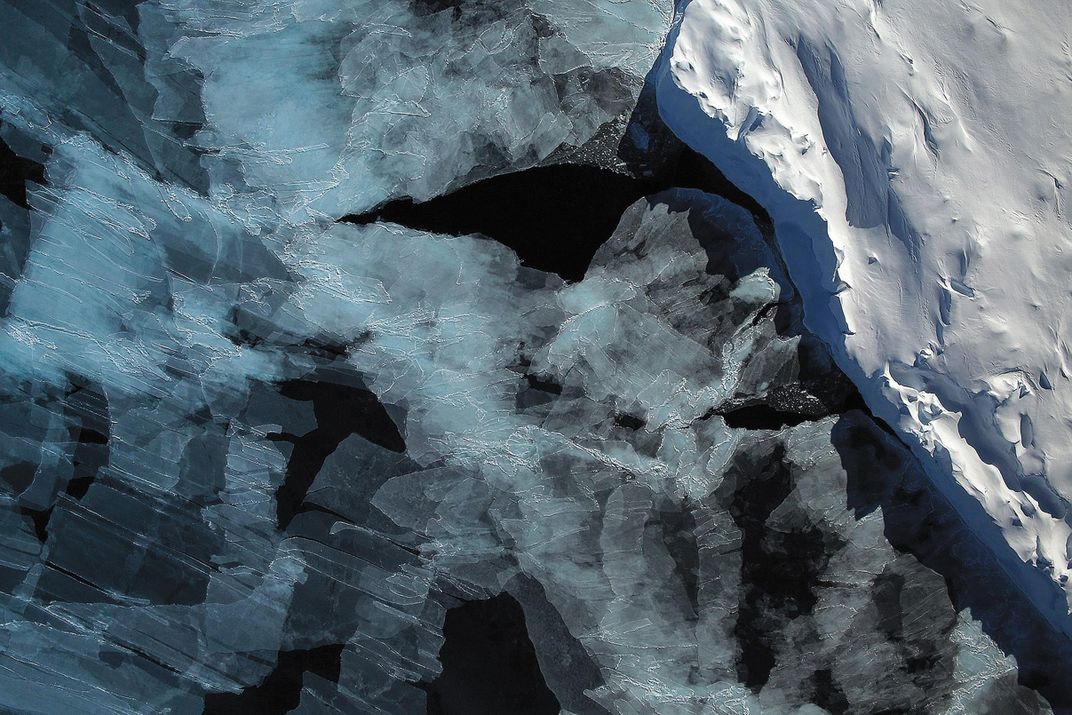
Finally we reach the edge of the ice sheet and the monolithic white shatters into chunks, as glaciers flow into the sea and break off into translucent blue icebergs. “There,” says John Sonntag, a NASA scientist aboard the P-3, looking down at one of Greenland’s most famous glaciers. “That’s what people have been worried about.”
Beneath us, the edge of the Zachariae glacier is a jumble of fragmented ice. Sonntag has flown over it many times, and he says the glacier looks even more broken up than usual. As Greenland’s ice moves off the land and into the sea, and glaciers at the bottom of the planet do the same, Earth’s oceans rise. Zachariae alone sloughs off about five billion tons of ice into the ocean each year.
Sonntag, based at NASA’s Goddard Space Flight Center in Maryland, is aboard the P-3 with several colleagues on this March day to track the meltdown. Designed in the 1960s to fly low and slow over the water to hunt submarines, the P-3 now carries scientists, skimming mostly frozen landscapes to gather crucial measurements on shrinking glaciers, dwindling sea ice, and crumbling ice shelves.
From the Arctic to the Antarctic, the news isn’t good. “We have a lot of ways of monitoring ice, and it’s disappearing, and most of it’s irreversible,” says Twila Moon, a glaciologist at the National Snow and Ice Data Center at the University of Colorado at Boulder. “The drumbeat is this constant loss.” For the hundreds of millions of people who live near coasts, the rising seas are encroaching on their homes. Islands in the Chesapeake Bay and Galveston, Texas, are just a couple of the places visibly losing land every day. Last year, the Alaskan village of Shishmaref voted to relocate five miles inland before the rising sea level wipes their homes off the map. Even the coastal communities that haven’t yet suffered damage are starting to realize the incoming water is a permanent problem that requires infrastructure to deal with it; in Florida, the city of Miami Beach is spending at least $400 million to raise streets and build seawalls to keep the water out, and pumps to get rid of it if that fails.
Globally, sea level has risen by about eight inches since scientists starting keeping records, in 1880. According to the 2014 climate assessment made by a team of 300 scientists for the National Academy of Sciences, global sea level is expected to rise by one to four feet by the end of the century. About half of that increase comes from expansion: As seawater warms, it expands. The other half comes from melting ice, including the enormous ice sheets of Greenland and Antarctica. By charting the current meltdown, scientists hope to better forecast the rising seas of the future—and perhaps help the world’s populations adapt to the changes already under way.
**********
A few decades ago, researchers suspected that Greenland and Antarctica were losing mass. They could see glaciers melting, but they couldn’t be sure of overall change because they didn’t have a method to weigh the entire ice sheet.
The first real evidence came in 2000. Seven years earlier, a NASA team, including Sonntag, began flying an aircraft back and forth over the Greenland ice sheet, shining a laser down to the surface and timing the return of its reflection to the aircraft. They created a countrywide map of the ice’s height. By repeating the flights over years, the researchers measured changes in the ice sheet and published definitive proof that Greenland is losing mass.
Today, the flights continue under a $15 million NASA program named Operation IceBridge. For several months each year, the team flies its P-3 and other aircraft over much of the Arctic and Antarctic to measure the ice. “Holy cow, it has done so much,” says Thomas Wagner, head of NASA’s cryosphere research program in Washington, D.C. (The “cryosphere” is all the frozen water on the planet.) “It has fundamentally altered our view of the ice sheets.” That’s largely because IceBridge has enabled scientists to map the bedrock below the ice, giving them much more accurate data on the thickness of the ice sheets above.
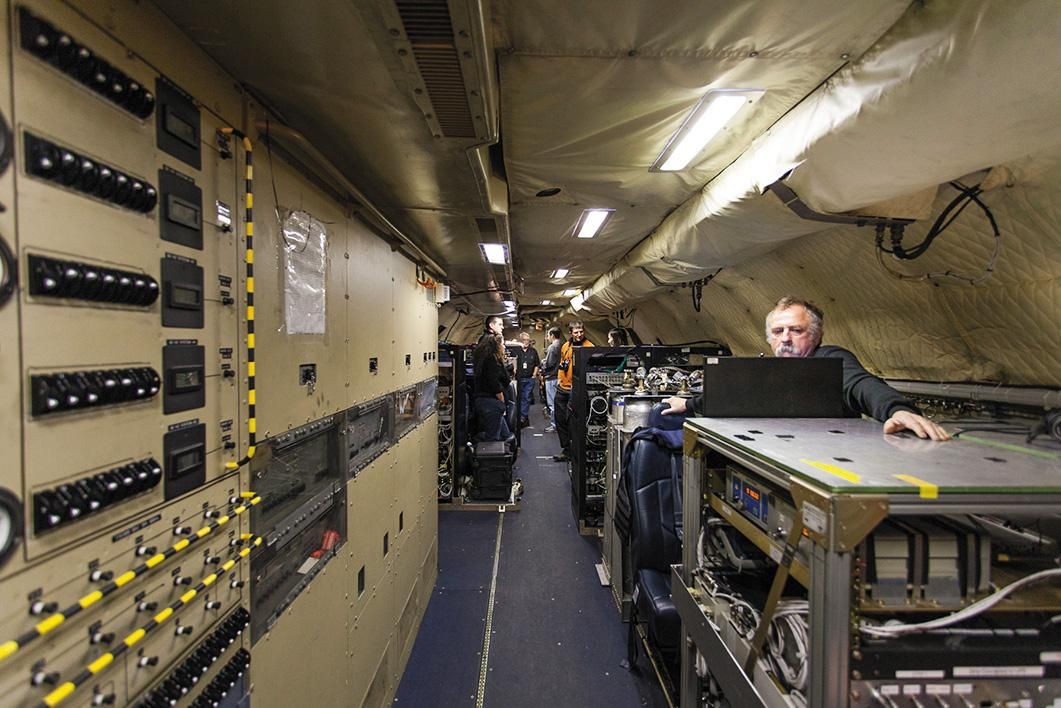
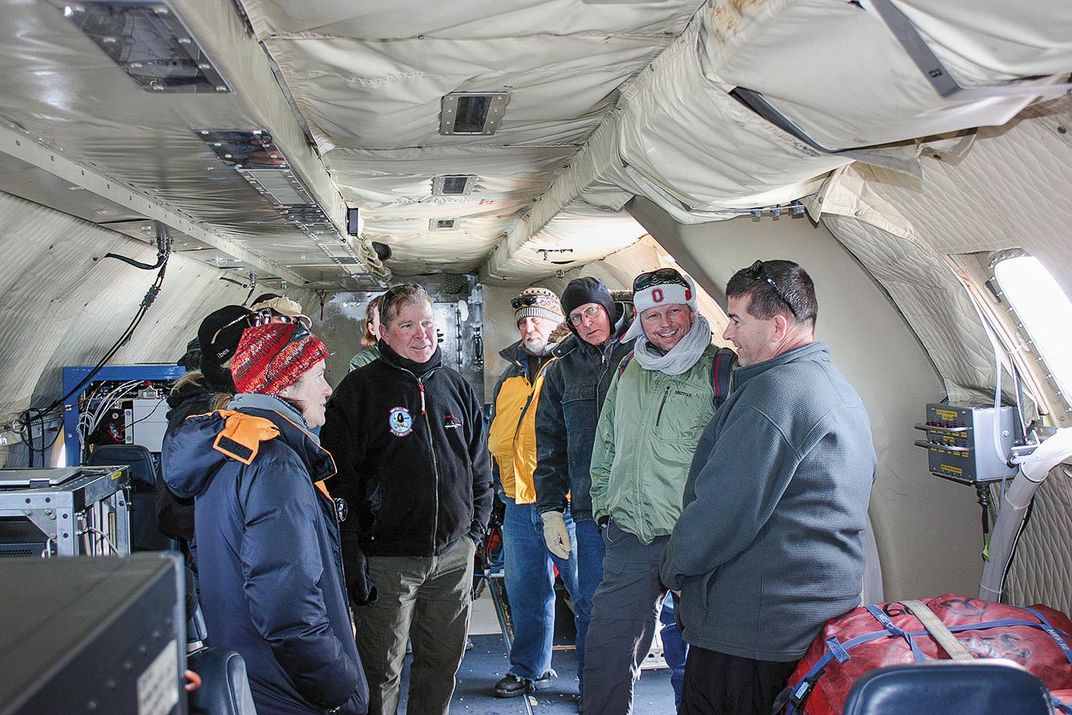
This spring, the IceBridge team deployed to Thule Air Base in northern Greenland for its annual Arctic study. Inside the base hangar, televisions broadcast warnings of how long it will take exposed skin to turn to frostbite. In the hours before its daily 8 a.m. departure, the P-3 is a hive of activity. Technicians scurry among the racks of scientific instruments that are bolted throughout the fuselage. Along with the laser-mapping system, the aircraft carries a radar suite to measure ice thickness, accumulation layers within the ice, and snow depth on top; a gravity detector to measure the depth of the sea floor beneath the floating ice shelves; and high-resolution cameras seeing both visible light and infrared.
Sonntag, who has spent 7,600 flight hours doing airborne science, takes a seat in his well-worn flightsuit. On this day, like most others, he is playing the crucial role of navigator. In order to accurately map changes from year to year, the airplane must fly a very precise route; Sonntag is the keeper of the waypoints for each flight path, making last-minute decisions on which routes to travel that day, based on weather and other factors, before plugging them into the aircraft’s computer. Today the P-3 will go west, to Canada’s Ellesmere Island—a challenging itinerary that involves flying up and down ice-filled canyons as rocky peaks rise above the wingtips.
Hours into the flight, turbulence created by high winds buffets the airplane sharply, knocking the laser system out of alignment. Jim Yungel, an instrument engineer for IceBridge, unbuckles himself quickly and takes a screwdriver to a floor panel. He’s been flying ice-mapping missions for nearly four decades—before the IceBridge mapping got under way, he flew on limited, one-off studies of individual icebergs and sea ice. Yungel lifts the panel and jams his hand into a series of green-glowing laser mirrors to make an adjustment. Beneath him, visible through the window in the belly of the airplane, ice rushes by.
“That should be it,” Yungel grunts and hops back into his seat. His monitor once again displays a wiggly green line on a blue background, indicating the laser has resumed taking data. “We were only out for about 20 seconds,” he says. (There are two laser mappers aboard the P-3, and the newer instrument, installed in the forward cabin, operated continuously for the entire seven-hour flight.) While several satellites also monitor changes in the polar regions, none currently orbiting can gather the kind of precise information about fast-moving glaciers that IceBridge can. (The mission is so named because it “bridges” the gap between IceSat-1, which was deactivated in 2010, and IceSat-2, which launches next year.)
The satellites in orbit can be useful for other measurements, however. Glaciologist Marco Tedesco of the Lamont-Doherty Earth Observatory in Palisades, New York, can watch the entire ice sheet melt from his office. Microwave sensors on a Department of Defense meteorology satellite can detect the liquid melting on the surface. “If you were looking at an energy source like a light bulb, you would see that the dry snow is a very dim light whereas wet snow is a super bright light,” Tedesco says. “The difference is stark.”
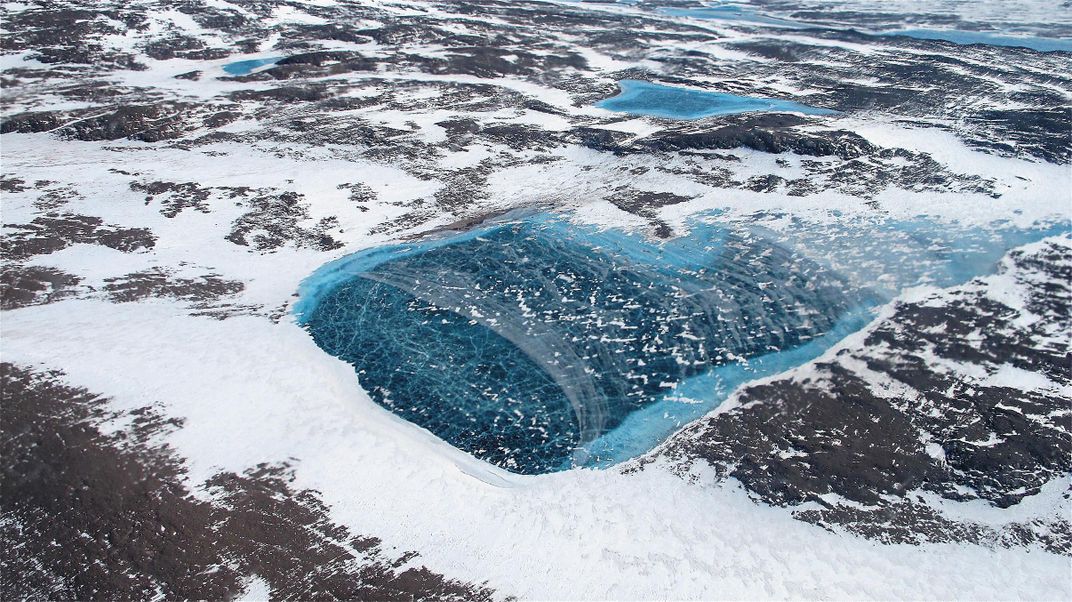
In 2012, he saw a difference that was not just stark but terrifying. In the space of just a few days in July, 97 percent of Greenland’s surface ice underwent some degree of melting. The event was so unprecedented, the National Snow and Ice Data Center asked Tedesco and a colleague to build a website that would attempt to use their research to explain it. A melt that extensive can put the environment into an alarming feedback loop: Water absorbs more of the sun’s energy than ice does, so ponds sitting atop the frozen landscape accelerate the warming. Satellite data shows a dramatic change in Greenland melting starting about 20 years ago, says Tedesco, “shifting from a period with little loss—before the mid-1990s—to extreme and sustained melting after the mid-1990s.”
But sometimes even the best satellite and airplane measurements aren’t enough to fully explain what’s happening in Greenland. One elusive problem is figuring out exactly where all this melted water drains. (In 2008, one scientist tossed dozens of rubber duckies into a melt hole in a Greenlandic glacier, in hopes of seeing them eventually pop out in the ocean. None were ever reported found.) This spring, some of Tedesco’s colleagues drove 125 miles across Greenland in a snowmobile, stopping to drill four 65-foot-deep holes along the way. They deposited instruments that measure the way water percolates down into the layers of dense ice and re-freezes each winter. That information will help scientists better understand the signals they are getting from satellites, as well as the paths through which meltwater drains each summer.
**********
At the opposite end of the planet, scientists are struggling to understand the melting ice in Antarctica, a landscape so much bigger than Greenland that flights or fieldwork aren’t adequate. “The only way to get meaningful observations of it is through monitoring by satellite,” says Helen Fricker, a glaciologist at the Scripps Institution of Oceanography in La Jolla, California. “Now we’ve got about a 20-year record, and all the techniques are showing us that the mass loss of Antarctica is starting to accelerate.”
Ice loss has been significantly pronounced on the Antarctic Peninsula, the finger of land that extends toward Chile. Air temperatures above the peninsula have increased 4.5 degrees Fahrenheit since 1950, and the floating ice shelves that fringe it have shrunk substantially. Because the shelves are already floating, they do not add to sea level rise when they melt, but scientists worry that as they collapse, the glaciers that flow into them no longer have anything holding them back. When this glacier ice reaches the ocean, it most certainly contributes to sea level rise.
The most dramatic example is the Larsen ice shelf on the peninsula. In recent decades, portions of the shelf have rapidly disintegrated, starting with the Larsen A shelf in 1995. The next portion to the south, Larsen B, broke up spectacularly in a matter of weeks in early 2002. Only a small piece of Larsen B is left, and flow from two of the three glaciers that feed that remnant has sped up in recent years.
Last July, an iceberg broke off the neighboring Larsen C shelf; it was the size of Delaware and weighed more than one trillion tons—one of the largest icebergs ever recorded. Even if the ice regrows, the new formation is likely to be less stable than it was before. “How glaciers respond to this crack is what we will see as other ice shelves warm,” Wagner says. “We’re watching this very closely.”
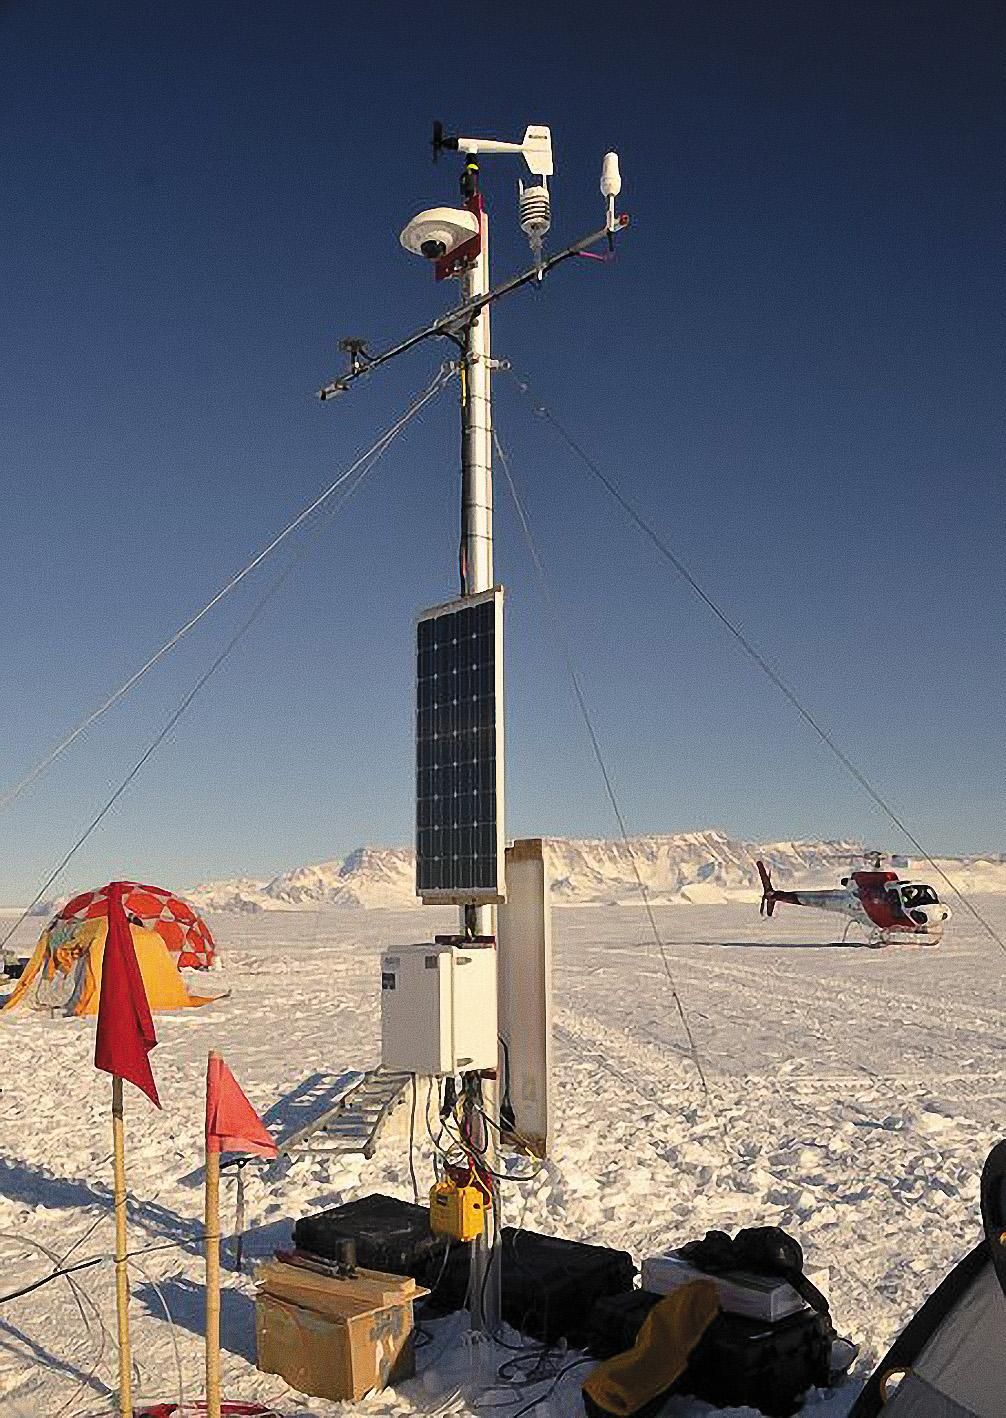
Few are watching more closely than Ted Scambos, a glaciologist at the National Snow and Ice Data Center who wants to catch ice shelf collapse in the act. But “you can’t stay on an iceberg when it’s starting to break up,” Scambos says with a grin. After the Larsen B disintegration caught him by surprise, he started working with colleagues to develop scientific instruments that could sit out on an ice shelf and monitor how the remaining pieces evolved. The idea was to combine a weather station with GPS and cameras, and put the whole rig as close as possible to where the ice might break up. Scambos calls the instruments AMIGOS, for Automated Meteorology-Ice-Geophysics Observing System, and they’re now studding the Larsen B ice shelf. He’s working on a more sophisticated version, AMIGOS-II, which will also study the water under the ice shelf’s surface.
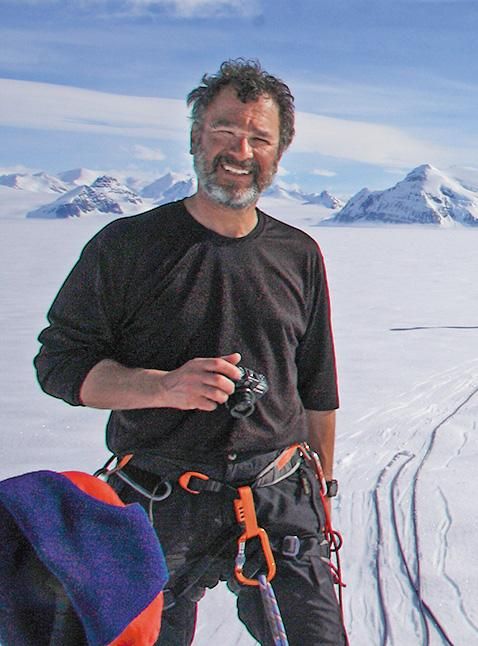
During a test last year on a frozen Colorado lake, Ronald Ross, the engineer who designed the AMIGOS-II system, showed off how it works. After making a hole through the ice with an auger, the team lowered a fiber optic cable bristling with instruments that can measure temperature, salinity, and other conditions at various depths. Nearby, the solar-powered weather station sits atop the ice, anchored with bolts to keep it stable even when 25-knot winds and flying snow buffet it—the conditions of a typical Antarctic winter. “The biggest challenge is that you can’t just roll up and press a reset button,” says Ross, whose company, Polar66 Engineering, is based in Boulder. “Once it’s there, you might not return for a few years.”
Earlier this year, Scambos took the first AMIGOS-II to the Antarctic and set it up on the Nansen ice shelf, near the Korean base of Jang Bogo. It took 16 helicopter flights to shuttle all the equipment to the site, where the team drilled through 1,300 feet of floating ice to install it. The station sits close enough to the base that the team can visit and retest it every summer before Scambos tries to deploy it in even more remote areas, where such testing won’t be possible.
That might be Larsen C or another significant target: the Thwaites glacier. It lies about halfway between Larsen C and the Korean base, and is one of the fastest-flowing glaciers on the continent. Unlike the Antarctic peninsula, which is losing ice because the air above it is getting warmer, the area around Thwaites is responding to a rise in ocean temperatures. Warm water is melting the leading edge of the glacier from below, effectively unpinning the mass of ice behind it.
Measurements taken by the Earth Remote Sensing satellite and other airborne radar instruments show that ice loss at Thwaites and five of its neighboring glaciers has doubled in six years, and the melting from the whole area now accounts for about 10 percent of global sea level rise. One 2014 study by the University of Washington’s Polar Science Center looked at how the ice is moving in and around Thwaites and concluded that it has already begun an irreversible collapse. The worry is that if Thwaites continues to melt significantly, it could be the cork unstoppering the bottle that is the West Antarctic Ice Sheet.
**********
Last april, Helen Fricker was part of a team who reported to California governor Jerry Brown how rising sea levels would affect the state—in fact, California is already feeling the effects. In San Francisco, a variety of high tides known as king tides are already flooding parts of the Embarcadero, the city’s historic waterfront. “We know the [sea level rise] is increasing and in fact beginning to accelerate,” says Fricker. “There’s no way it’s going to stop.” With no mitigation, the ocean surrounding the Bay Area is predicted to rise between 1.6 and 3.4 feet by 2100, but even the best case scenario shows the water level likely to rise high enough to chronically flood the San Francisco and Oakland airports and make tens of thousands of nearby homes unlivable. (The absolute worst case scenario comes if the entire West Antarctic shelf rapidly melts, raising sea level by 10 feet and wreaking havoc on California’s population, almost three-quarters of which live near the coast.)
In California, cities and counties are now required to incorporate climate change into their long-term planning. Like Miami Beach, communities around the country are partnering with local scientists and engineers to identify and address their greatest vulnerabilities. In Virginia, the U.S. Navy has been raising piers at its base in Norfolk. In Boston, city planners are mapping out berms and parks around the harbor, an area that includes Logan International Airport, to figure out how to protect sites from high water.
Carbon dioxide, a heat-trapping gas produced by, among other things, the burning of fossil fuels, is now present in Earth’s atmosphere at concentrations of more than 400 parts per million—compared with 280 parts per million at the start of the Industrial Revolution. “You put carbon dioxide into the atmosphere, you warm the global average temperature, and ice melts at zero degrees Celsius,” says Helen Fricker. “Those are facts.” Sixteen of the 17 warmest years since 1880 have all come since 2001, with 2014, 2015, and 2016 each breaking the previous year’s record for average global surface temperature.
How quickly the seas rise will depend on surface and air temperatures, which in turn depend on the amount of greenhouse gases released into the atmosphere. For many climate scientists, the best case scenario is one that limits temperature increases to no more than 3.6 degrees Fahrenheit above pre-industrial levels. To keep to that limit, scientists at the National Center for Atmospheric Research believe that we would need to cut emissions in the next 50 years to the point that we actually reach negative emissions—that is, we’re pulling out more carbon dioxide from the air than we’re putting in. Even if the carbon dioxide concentration stayed around where it is today, another study by the center predicts that Earth will continue warming about another degree before it stabilizes from the rapid changes over the last century. That means an unavoidable amount of sea level rise is already locked in.
As study after study confirms the great polar meltdown, it might seem like a depressing time to be a cryospheric scientist. But many have found ways to cope, in part by throwing themselves even more deeply into their work. “Every extra study that we do, and every week of data we collect, is more affirmation that what we have said is happening is actually happening,” says Fricker. Twila Moon agrees: “I’m still a person who has some kind of belief that I can help save the world,” she says. “You have to have that.”
Back in Thule, Sonntag knows that his job may never be done. “I genuinely believe we’re doing work that matters,” he says. “Regardless of the politics, it’s important that humanity knows what’s going on with our planet. Sea level is changing, and it will affect humans in a big, big way. We are going to have to adapt to that.”
And with that, he turns away to begin planning the next day’s flight.

Subscribe to Air & Space Magazine Now
This story is a selection from the October/November issue of Air & Space magazine