The Planck Telescope: News From the Dawn of Time
Will a new picture of the universe’s first light overturn a theory that has reigned for 30 years?
/https://tf-cmsv2-smithsonianmag-media.s3.amazonaws.com/filer/5f/4a/5f4a38cb-e370-43c7-881e-928c57f6b778/01_plancks-universe_feb_14.jpg)
Tune an FM radio to one of those empty spots between one station and another and out comes the buzz of static that says: Nothing to hear here. But there is something. Deep within the static is an extraordinarily faint trace of the defining period in the history of the universe. What you’re almost hearing is a 13.8-billion-year-old signal from the Big Bang.
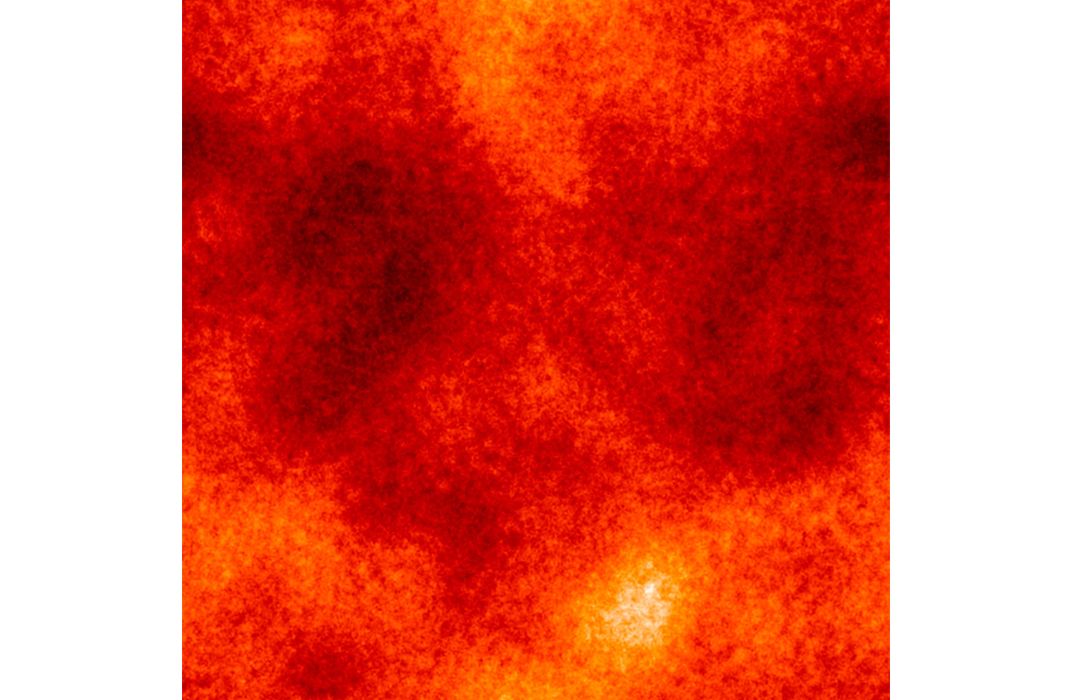
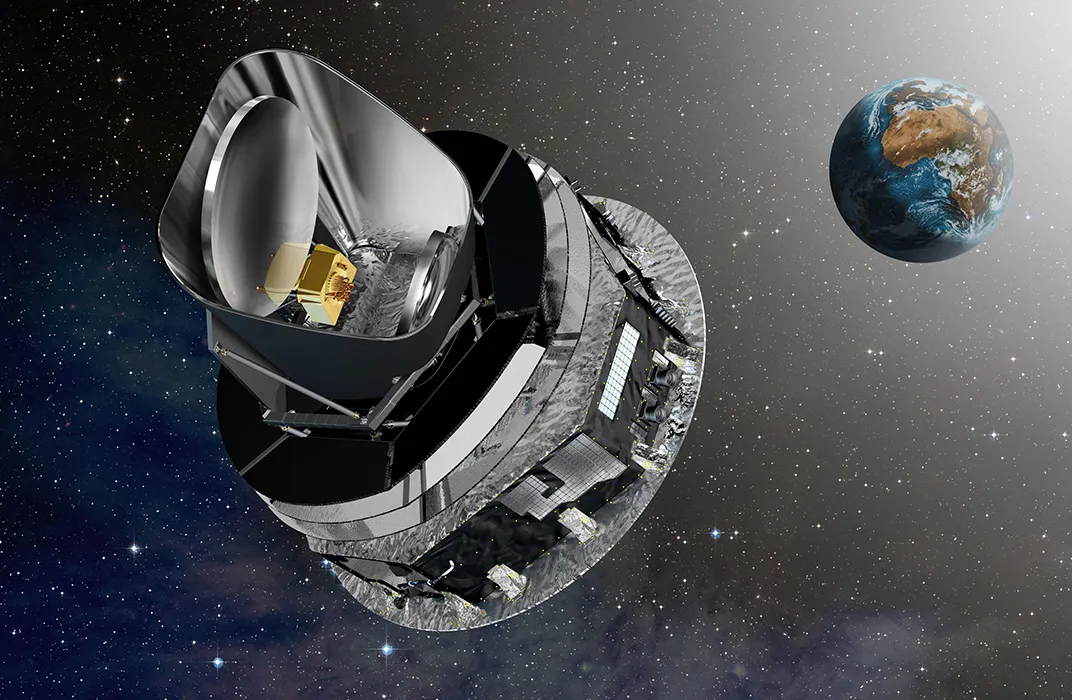
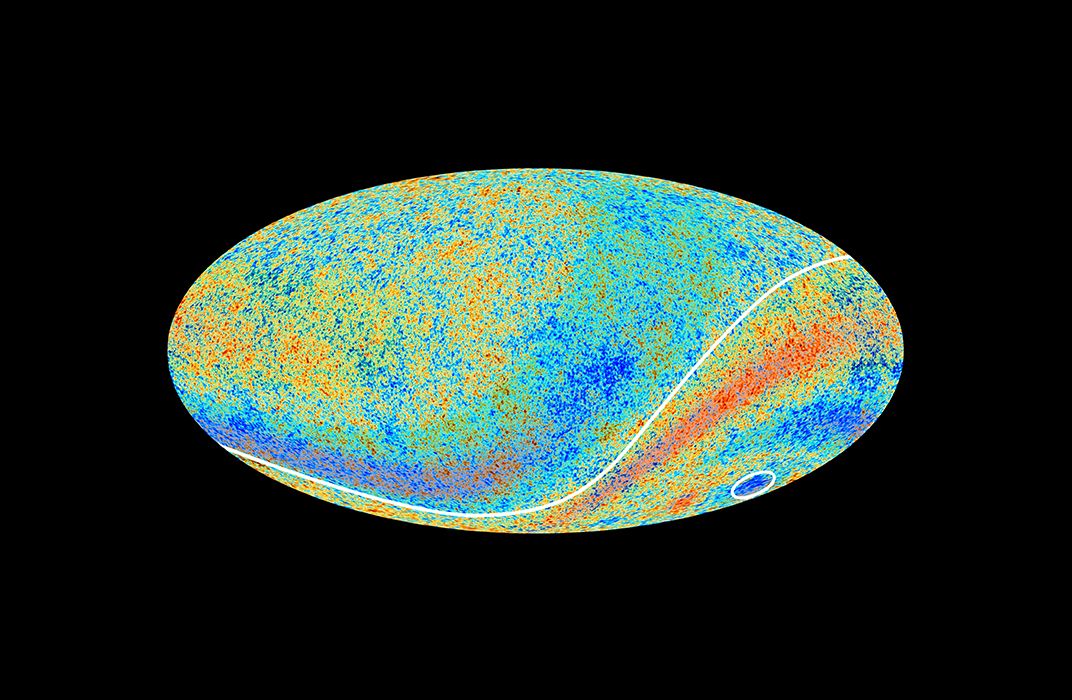
That signal—the oldest light of the cosmos stretched by the expansion of space into invisible, pervasive microwaves—has just been gathered and measured with greater precision than ever before. The gathering was done by a $900 million space telescope launched by the European Space Agency and named Planck, for the German physicist Max Planck, a father of quantum mechanics. Beginning in 2009, the spacecraft tagged alongside Earth in its orbit around the sun (sheltered from the sun by Earth’s shadow). Last spring, the mission’s international team of scientists released Planck’s initial results, and a somewhat puzzling picture of the universe emerged. In the new portrait, one side of the universe doesn’t quite match the other, and an odd cold spot stretches for hundreds of millions of light-years, a distance making it the largest known structure in the universe.
“These anomalies do not fit,” says Jan Tauber, ESA’s Planck project scientist. “It’s very painful because we don’t understand it and it has the potential to undermine our theories. Unless we have a theory, we don’t know what to do with it.” The theorists, he says, “are out there furiously trying to come up with something.”
But cosmology, the study of the large-scale properties of the universe, is a science of statistics and probabilities, and many cosmologists believe that a lopsided universe is not so improbable that it demands new theories to explain it. Charles Lawrence, an astrophysicist at NASA’s Jet Propulsion Laboratory and NASA’s Planck project scientist, is among them. “What is remarkable is that the large-scale structure and contents of the universe are described extremely well—not perfectly, but extremely well—by a model that has only six adjustable parameters,” he says. To describe the universe—its age, its content, its speed of expansion—cosmologists have constructed theoretical models based on the phenomena they observe. The dominant, or standard, model assumes six variables—the parameters Lawrence mentions—among them, how fast the universe is expanding and the amount of matter it contains. By slightly adjusting the values of each of the variables, and comparing the millions of permutations with the data from the telescope, researchers find the description that offers the best match.
“If the universe was constructed in that statistical prescription by varying six parameters,” says Lawrence, “one out of every few hundred times, you’d get a universe where one side of the sky is as different from the other as we observe. So is that really, really so unlikely that we should lie awake at night worrying about it?”
Planck mission scientists are still extracting information from the cosmic microwave background so that physicists can offer a more complete and satisfying explanation of how the universe we see today expanded from the hot, dense speck it was 13.82 billion years ago—its age, according to Planck’s measurements. That measurement makes the cosmos 80 million years older than previously thought.
The new data from Planck offers more than twice the resolution of previous space-based instruments used to study the cosmic microwave background (CMB) and detects differences in temperature down to the 100 millionth of a degree. Planck’s first color-coded temperature maps of the CMB assemble close to a trillion observations of a billion different points in the sky. The signals are so small, so faint, and so easily obscured by stray radiation from the Milky Way and other sources that a Cray XE6 supercomputer at Lawrence Berkeley National Laboratory—capable of more than a quintillion calculations a second, one of the fastest in the world—had to spend weeks sifting the images from the satellite’s prodigious amount of data.
“Think about it a thousand years from now: This is when we first got the picture,” says Lawrence. “That would seem like a pretty exciting time.”
These more precise measurements have narrowed the range of acceptable models explaining how the universe expanded, including models for the theory of inflation: the idea that 10-35 second after the Big Bang, the universe expanded 100 trillion trillion times, from a mote far smaller than an atom to something far bigger than the Milky Way.
“Less than 100 years ago, we didn’t know that the universe was bigger than the Milky Way,” Lawrence says. “And here we are talking about what happened 13.8 billion years ago! What happened 10 to the negative 35 second after the Big Bang! Ionized universe! Temperature 3,000 degrees Kelvin! It’s just so cool!”
The field of cosmology has advanced spectacularly since the middle of the last century. Only since 1964, when radio astronomers Arno Penzias and Robert Wilson famously noticed a bothersome hiss in their Bell Labs antenna, has the Big Bang theory found acceptance among the majority of scientists. Badly named (by British astronomer Fred Hoyle who didn’t believe in it), the theory has nothing to do with an explosion. “ ‘Big Bang’ just says the universe was hot and dense a long time ago,” says Lawrence. The theory envisions the early universe as a glowing fog with a temperature of billions of degrees—so roiling hot that atoms could not form and light could not escape for about 370,000 years. That’s when the soup cooled to around 3,000 degrees Kelvin (5,000 Fahrenheit), simple hydrogen atoms formed, and photons were freed.
In the late 1940s, astrophysicists had theorized that the first light waves should still be around, cooled to microwave radiation with a temperature of about five degrees Kelvin (just above absolute zero, where all heat energy vanishes). That cosmic microwave radiation was the hiss first heard by Penzias and Wilson. They found that the signal had the same strength in all directions, measured its temperature at 2.7 degrees Kelvin (-454 Fahrenheit), and won the 1978 Nobel Prize in physics for the discovery.
Theorists further predicted that the radiation would preserve the signature spectrum of the universe’s first light. Twenty years after Penzias and Wilson found the cosmic microwave background, the Cosmic Background Explorer, or COBE, satellite confirmed its telltale spectrum.
“The CMB is one of the best examples of the powerful interplay between experimentation and theory and just how productive and important they are to each other,” Lawrence says. For one thing, the uniformity Penzias and Wilson had seen in the cosmic microwave background temperature presented a puzzle. The temperature is the same, even in regions that are billions of light-years apart. “The fact that these regions have the same temperature means that they were sort of cooked together,” says Charles Bennett, a physics and astronomy professor at Johns Hopkins University in Baltimore. The distant regions, cosmologists believe, must at some point have been in contact, yet that seems impossible since the universe has not existed long enough for light to travel all the way from some regions to others. Solving this puzzle was one of the inspirations for the theory of inflation.
Theory, in turn, makes predictions about the universe that experimentalists can test, mainly through measurements of the cosmic microwaves. “We should be very grateful we have the CMB. It’s our fossil,” says Bennett. Bennett’s first job after graduating from MIT in 1984 was working with an instrument on the Cosmic Background Explorer satellite; at NASA’s Goddard Space Flight Center in Maryland, he was on the team searching the cosmic microwave background for small temperature variations, the results of random quantum fluctuations in the primordial universe. What are those? In quantum field theory, matter and energy at sub-atomic scales constantly pop in and out of existence, creating slight vibrations or perturbations. “Because all the evidence suggests that quantum mechanics is a good description of nature, whatever was going on [in the early universe], you would expect to see these tiny fluctuations in density at 10-to-the-negative-35 seconds after the Big Bang,” says Charles Lawrence.
“That’s just how physics works.”
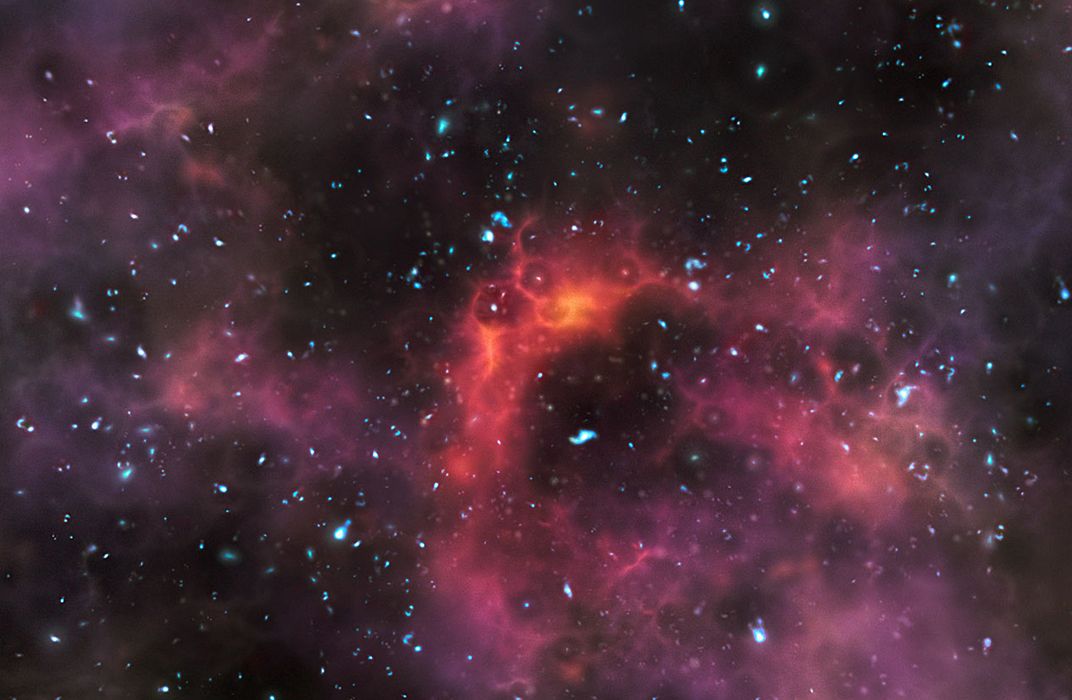
Inflation amplified the most infinitesimal fluctuations imaginable until gravity took over and consolidated the tiny differences in density into planets, stars, galaxies, and the largest structures we know. As Charles Bennett puts it, “nature turns up the contrast over time.” But signs of those fluctuations should be visible in the first light waves—the CMB—as areas of temperature variation. Inflation predicts that some spots in the sky will have a temperature slightly higher than average (by millionths of a degree); other spots, a slightly lower temperature.
On the scale that COBE was observing, the temperature variations were not easy to see. Project scientist John Mather recalls the first color-coded image teased out. The team spent months checking and cross-checking the results before announcing that COBE had indeed spotted the primitive blueprint of all matter in the universe.
“I said, ‘Here is a discovery that will become the basis of a new subject,’ ” recalls Mather, who shared the 2006 Nobel Prize in physics for the COBE results. “People said we were more worried that we got something wrong than people who disagreed with us. But we had to be absolutely sure.”
The new subject was examined again, beginning in 2001, when NASA launched the Wilkinson Microwave Anisotropy Probe. (In this case, “anisotropy” refers to how the temperature of the cosmic background radiation differs with direction.) “WMAP allowed us to see fluctuations all across the sky,” says Bennett, the satellite’s principal investigator. “That by itself, at least qualitatively, was evidence for inflation.” But WMAP found something else.
Analysts plot the distribution of the temperature variations on a graph they call the power spectrum (see graph, opposite). Peaks in the spectrum correspond to the greatest differences in temperature; the highest peak occurs at distances of one degree (about half the size of the full moon). You might think of this one-degree distance as the length between the trough and peak of a wave.
“Everything you see [in the graph] is the development of the universe since inflation,” says Bennett. “But the fact that there are extra fluctuations at the one-degree scale all over the sky—you’d say: Well, what coordinated that? And the answer is: Inflation coordinated that.”
Cosmologists have devised another test for the theory of inflation, based on the size of the areas showing temperature deviations. That size is related to the quantum fluctuations in the primordial universe; it represents the distance that sound waves generated by the fluctuations traveled in 370,000 years—the time between the end of inflation and the moment when the universe had cooled enough for photons, or light waves, to begin the journey outward.
Imagine the distance that the sound waves traveled as the short side of a very long, skinny triangle. “The long side [of the triangle] is the distance that light travels in the next 13.8 billion years to us,” says Lawrence. “You can see an angle as one distance divided by another, and we measure that angle very well.” The angle is one of the six parameters in the model the Planck team constructed.
And now we come to somewhat familiar territory. In high school geometry, students learn that the sum of the angles of a triangle is 180 degrees. But if the triangle is superimposed on a sphere, the sum is greater than 180 degrees; if superimposed on a shape with negative curvature, like a saddle, the sum is less than 180 degrees. Inflation predicts that the shape of the universe will be most like a flat piece of paper, where the sum of the angles in a triangle equals 180 degrees. And that is what both WMAP and Planck measured—though not in the three dimensional analogy just described, but rather in the four dimensional mathematics of space-time. “Everything in cosmology is in four dimensions, but none of us can picture four dimensions,” says Charles Bennett.
“The math describes it in four and we understand it in four, but we don’t picture it in four any more than you do. I mean, we don’t experience relativity either, but we know how to calculate it. We know it works.”
According to the latest measurements and calculations, the universe is flat. “I like to say, ‘As accurately as we can measure it, it’s consistent with flat,’ ” hedges Bennett. “There’s uncertainty about what you expect in a theory,” he says, a plus-or-minus margin, like the uncertainty in opinion polls. “Inflation doesn’t predict that the universe is exactly flat. If inflation went on forever, it would be exactly flat, but inflation ended. One thing that we know for certain is that we are not still inflating,” he laughs.
“Without inflation, you don’t expect [the universe] to be anywhere near flat. If you start with the universe being just off of flat, it will get more and more off of flat. To come back 13.8 billion years later and find that it’s still close to flat would be odd. I use the analogy of standing a pencil straight up on its tip. To come back 13.8 billion years later and find the pencil still like that: not likely.”
Like Lawrence, Bennett believes that the temperature variations that are seen at the largest scales are consistent with predictions. Other cosmologists argue that such features as the lopsidedness in temperature counter the premise that inflation smoothed the universe on broad scales, enforcing the same laws of physics everywhere. Those features also defy a basic cosmological principle: that space should look similar in all directions, and no place should be more “special” than another.
“Some people take [the observed lopsidedness] and calculate how probable it was that we would see something like that,” Bennett says, and come up with the answer that “it was astonishingly not probable and therefore there’s something wrong with the theory. So what’s wrong with that analysis? Here’s the analogy I use: Suppose you’re walking along on the sidewalk, and a leaf falls off a tree and hits you on the head at the precise moment you’re walking by it, and I come along and say, ‘That was astonishing! What were the chances that that particular leaf on that particular tree should fall just at the moment that you’re walking by?’ Well, if I calculated the probability of that, it would be tiny. But it’s a ridiculous thing to calculate. The problem is that lots of improbable things happen all the time because so many things happen.
“Once you identify something unusual in the data that you didn’t predict, you’ve already started from the answer and worked backward, which is the same problem with the tree and the leaf. You can’t say it’s improbable after you’ve observed it; you would have to ask the question up front. What are the chances of any leaf falling from any tree hitting you on the head at the moment you walk by? And you’d find that that’s not so improbable.”
Bennett concludes with the opinion expressed by many Planck scientists: “The lopsidedness may have some significance. You can’t say that it absolutely doesn’t. But you can’t really say that it does.”
The Planck data includes other intriguing observations that cosmologists are currently debating. The data indicates that hundreds of galaxy clusters are streaming together toward the constellation Centaurus, as if tugged by something beyond the visible universe in what has been termed “dark flow.” Most Planck scientists concluded again that the data was not statistically significant, but one, Fernando Atrio-Barandela of Spain’s University of Salamanca, found the opposite, and withheld his name from the official Planck results. He suggests that inflation could have lasted long enough to magnify some features beyond what we can see, and that they pull on parts of the universe we can. This thinking “does not contradict the inflation paradigm; it complements it,” Atrio-Barandela says.
WMAP had spotted traces of these “anomalies,” but scientists largely dismissed them as likely a matter of chance. Planck’s precision makes that more difficult. It also exposes the unease of cosmologists without a satisfying theory to explain what they see. They talk a little like acrobats without a net, unsure whether the new observations will push them off the standard theories that have been guiding them for decades.
One team published a study in 2006 predicting that Planck would find a “smoking gun” of oddities in the CMB—such as the cold spot and lopsidedness—that reveal other universes beyond our view are pulling on or have collided with ours. This theory of a frothy “multiverse” could also help explain dark flow. But others argue that if we indeed do live in a multiverse, Planck would have revealed it. “If there were really a multiverse, it would be much clearer,” says Paul Steinhardt, a theoretical cosmologist and the Albert Einstein Professor in Science at Princeton.
Steinhardt then turns the tables. He says the lack of evidence for a multiverse, plus other complications, undercuts the idea of inflation itself. His argument would be easier to discount if Steinhardt himself had not helped fashion inflation back in the 1980s. The problem, he says now, is that the same quantum fluctuations credited with creating galaxies also make it impossible for inflation to ever completely stop; while it may stop here or there, the random fluctuations keep it going elsewhere. Eventually it produces an infinite number of island-like universes, with an infinite number of physical properties. So where are they?
“The Planck results reveal a remarkably simple and uniform universe,” says Steinhardt. “And that is the problem. Inflationary theory predicts a multiverse, and the multiverse should be evident.”
“Unless a convincing theoretical explanation can be found, the anomalies are likely to remain statistical curiosities,” says Hiranya Peiris, a cosmologist at the University College London. Her team searched WMAP data for bubble universe collisions and found several candidates, but none were definitive. They are doing the same with Planck’s data while also running computer simulations of such collisions, using the equations of general relativity to better understand exactly what the collisions should look like. “The statistical significance of these ‘anomalies’ is not at a level where you would say the evidence is overwhelming,” Peiris adds. “So in this sense, the ball is in the theorist’s court.”
Last October, with its fuel depleted, Planck was turned off, but team members are still analyzing the data it collected. In a few months, they will release a second set of results that could offer the strongest evidence yet for inflation. “One of the biggest single [pieces of evidence] that would tell us about inflation has to do with the pattern of polarization on the sky at large angular scales,” says Charles Lawrence. “If we could observe this—if there were a significant background of gravitational waves in that 10-35 seconds after the Big Bang—it would leave an imprint that we could detect, and it would tell us what the energy scale of inflation was.” Inflation would have produced gravity waves, and, says Lawrence with satisfaction, “the pattern of polarization produced by gravitational waves isn’t produced by anything else.” Planck was not optimized to detect this pattern of polarization; it was optimized to detect temperature differences. Charles Bennett and other astronomers are working on ground-based instruments—some in the Atacama desert in Chile, others in Antarctica, the regions where there is the least atmospheric interference—to look for the polarization patterns that may not show up in the Planck data.
Today’s precision cosmology, which began with COBE and continued with WMAP and Planck, requires theorists and experimentalists to cooperate in order to resolve the statistical variations in data. In the 20 years since Jan Tauber joined the Planck team, he has watched cosmology seesaw, as theorists and experimentalists race to catch up to each other. “Now they’re being forced to talk,” he says.
The odd reality of cosmology—of any science— is that anomalies are interesting because they defy theory, but may not be taken seriously until they are explained by a theory the experimentalists can test. They could also turn out to be little more than unlikely patterns, like tossing a coin and coming up with 10 heads in a row.