Penguin Spotting, and Other Cool Satellite Tricks
You’d be surprised what you can see from 300 miles up.
/https://tf-cmsv2-smithsonianmag-media.s3.amazonaws.com/filer/1f/0a/1f0abeab-6bd8-441e-9732-55399ddbd8c3/10b_am2018_optionalpenguinpoop_live.jpg)
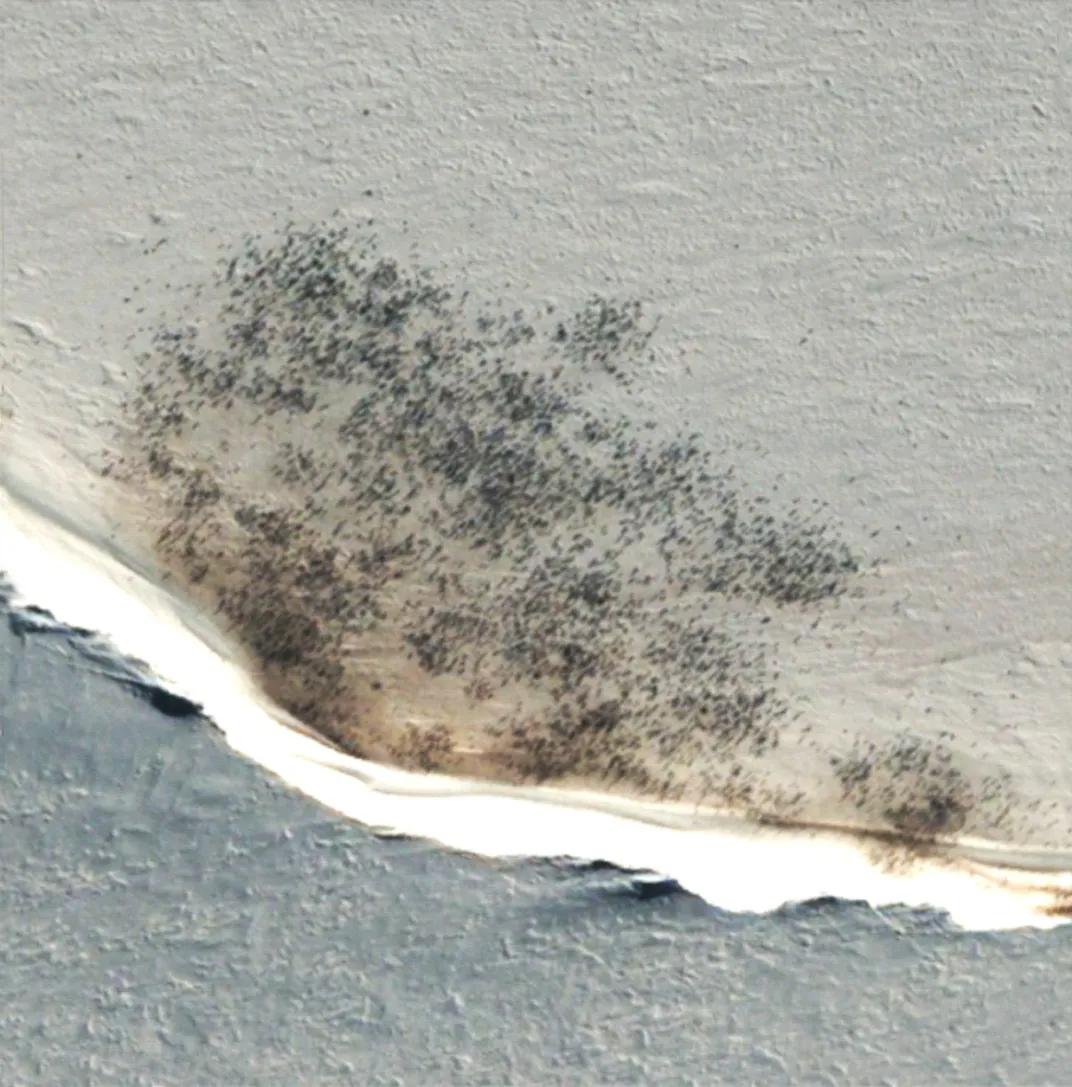
At first glance the picture might be an abstract oil painting or, less artistically, poppy seeds scattered on cream cheese. The “cheese” in this case is a field of ice off the coast of Antarctica, and the black seeds are emperor penguins. The photo was taken from space, and is a good example of how satellite imagery is helping biologists study wildlife populations in new ways. No scientist needed to set foot near the penguin colony or fly an airplane overhead: High-resolution images from an orbiting QuickBird satellite were good enough to monitor the colony’s health over time.
“The advent of remote sensing allows us basically to see some of these areas that you physically cannot get to, no matter how hard you try,” says Michelle LaRue of the University of Minnesota. She and her colleagues use high-resolution images purchased from DigitalGlobe, Inc., one of a few private companies that license satellite imagery to governments and academic researchers. Other scientists use free satellite images from Landsat and other government-run programs. Although those tend to be lower in resolution, they demonstrate how remote sensing is important for the literal big picture: The huge areas of land surveyed by satellite make possible research that couldn’t be done otherwise. That’s true whether the location is (like Antarctica) hard to get to, in a conflict zone, heavily populated, or just too darn big.
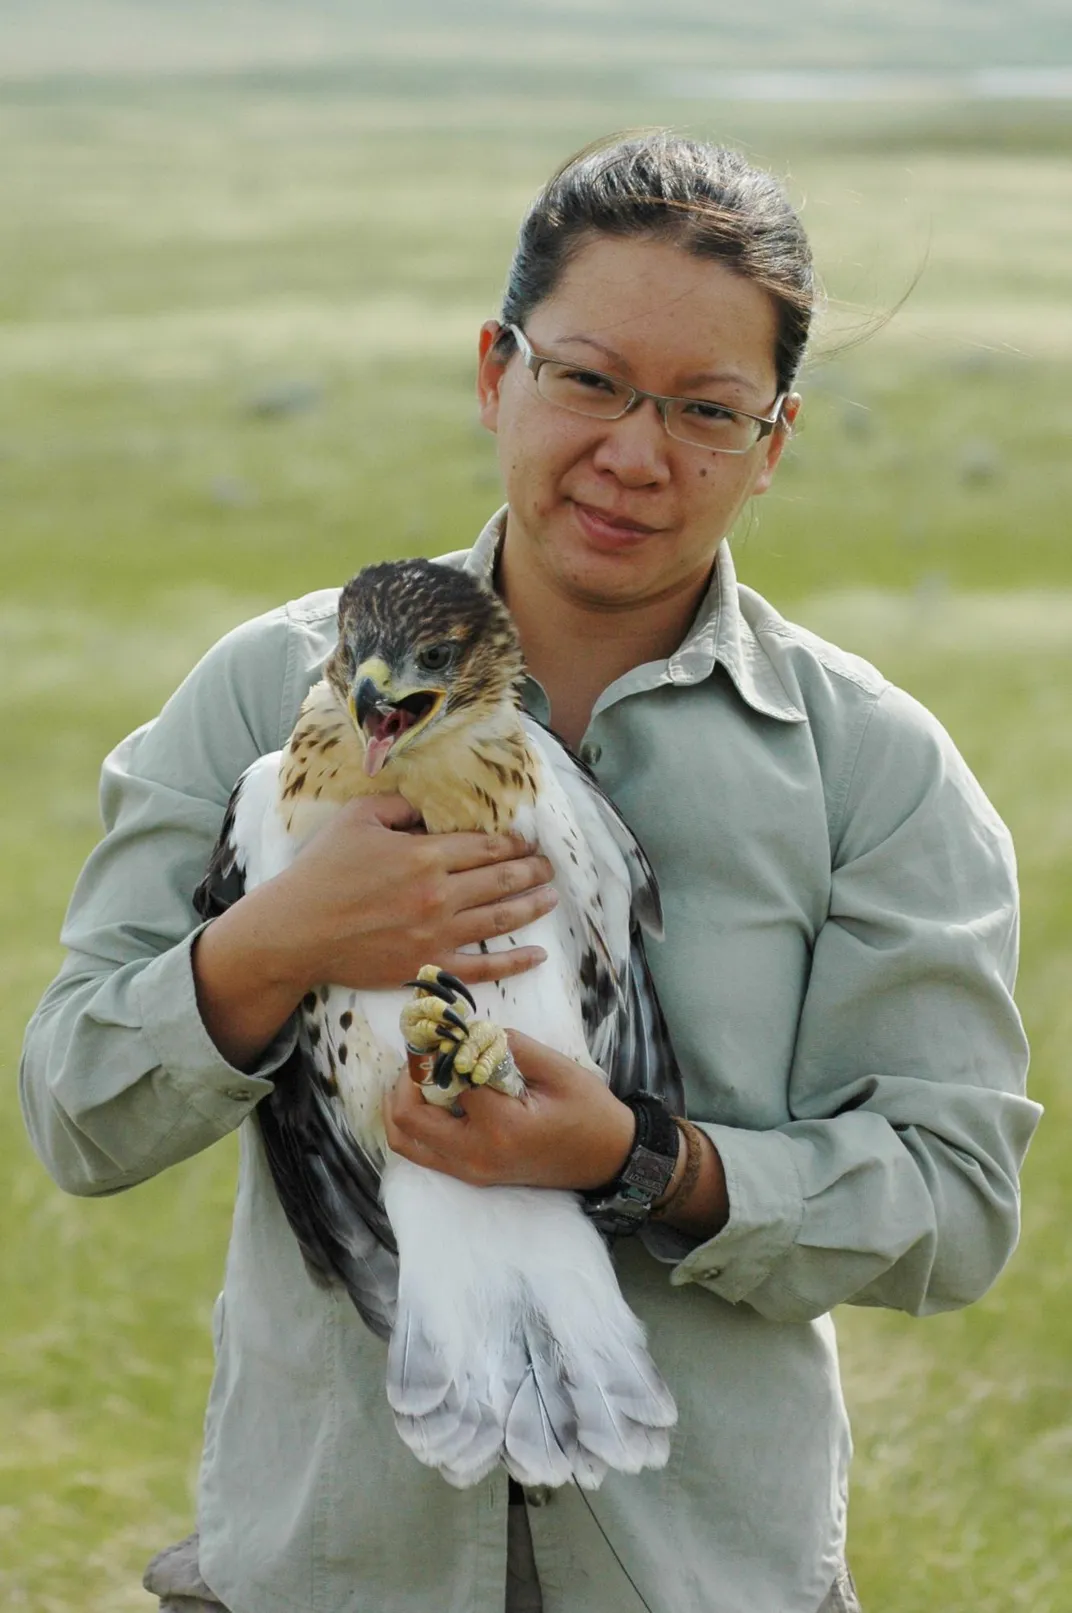
“We span about 300,000 square kilometers [116,000 square miles] of study area,” says Janet Ng of the University of Alberta. Ng studies birds in the prairie: Ferruginous Hawks and Common Nighthawks. Like many wildlife biologists, she uses a combination of satellite imagery and GPS location tags to get a fuller picture of the animals’ behavior and their habitats.
“Common Nighthawks migrate to the southern hemisphere,” she says, “and as hard as I try, I can’t always convince people to fund research expeditions down to Central and South America. The only way we can cover two hemispheres [and] six countries is using these remote-sensed satellite images.”
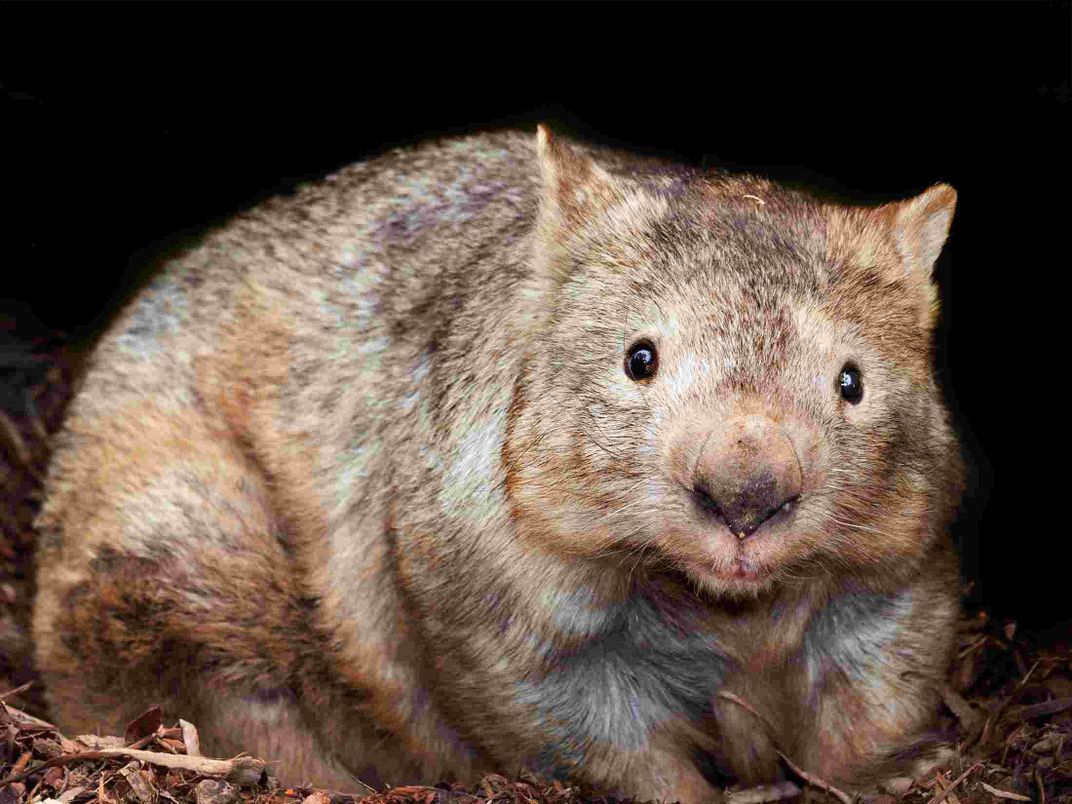
Orbital imagery has in fact become an essential tool for many biologists, whether they’re trying to distinguish between different types of vegetation for habitat studies, monitor whales in their breeding grounds, or—as in the case of geographer Ernst Löffler—learn more about Australian wombats.
In 1976, Löffler had a mystery on his hands. Something was destroying large swaths of vegetation in the Nullarbor Plain of southern Australia. At the time, Löffler was working for the Commonwealth Scientific and Industrial Research Organisation (CSIRO), the Australian government’s research agency, and part of his job was to map the environment of South Australia. “In view of the size of the country, the mapping of environments was not feasible from conventional aerial photographs, and therefore it was decided to use the newly available Landsat imagery,” he says. The first satellite in this long-running series had been launched just a few years earlier, in 1972. Landsat 7 and 8 are currently in orbit, and Landsat 9 is scheduled to launch in 2020.
When Löffler and his colleagues looked at the satellite images, they were puzzled to see splotches of bare ground in Nullarbor Plain. The vegetation-free spots appeared to stop abruptly at a straight line cutting across the countryside, the location of one of the fences erected in Australia in the early 20th century to contain dingos. And the loss of vegetation seemed to be increasing over time.
Then as now, Nullarbor Plain is a dry, inhospitable place: The name literally means “no trees” in Latin. But what seems hostile to us is home to southern hairy-nosed wombats—small, barrel-bodied marsupials who live in colonies of up to 10 animals, digging warrens in the dry soil that provide refuge from daytime heat and sun. Even though the individual animals were far too small to see from orbit, Löffler could locate their warrens from the Landsat imagery.
“I was intrigued by the roundish areas of bare ground showing up [in Landsat pictures] as nearly white patches in the low shrubland,” says Löffler. “After the routine work for the survey was finished, I revisited the area together with my colleague Chris Margules, and we could verify that the patches were indeed areas of wombat activity.” The animals had eaten whatever plants they could find around their warrens in that desolate landscape.
Finding wombats in Australia doesn’t sound like much of a discovery, but it was the first time someone directly observed wildlife behavior from space. Löffler and Margules showed that the animals altered their environment enough that the change became apparent in pictures taken from more than 500 miles up. If satellite images could see that—when nobody had ever planned for such an application—what other discoveries might follow?
Wide open spaces
“This is the first time anybody has actually been able to track migration of Common Nighthawks,” says Janet Ng, whose project is managed by the Smithsonian Migratory Bird Center’s Migratory Connectivity Project. Ng relies on another kind of satellite—GPS—to give her the locations of birds who have been fitted with miniature GPS tags. Then, she explains, “we can overlay those locations on top of satellite imagery, and that tells us where these birds have been spending time. We certainly had no idea beforehand, and we wouldn’t have the ability to do this without satellite images.”
Ng chose these particular birds to study because they’re in trouble. “Aerial insectivores, which includes birds like the nighthawks, have been tanking quite a bit in the last few decades,” she says. To understand why their population is declining, she needs to follow them from their Canadian breeding grounds to wherever they spend the winter, as well as any migratory routes in between.
This is science on both a small and a large scale, in which figuring out what’s driving the birds’ behavior requires considering construction of new roads alongside global climate change. Ng uses data from NASA’s 19-year-old Terra satellite, which uses a suite of sensors to monitor the land, air, and ocean. “A lot of these landscapes are changing year to year, decade to decade, and certainly over longer periods of time,” she says. “It’s remarkable what we can do remotely sitting at our computers in our office with no windows, understanding how that landscape has changed over time and what that could mean to animals living there.” The results of Ng’s study are still coming in, but she and her colleagues already have learned more about the wintering and migratory habits of prairie birds than they ever had before.
Follow the guano
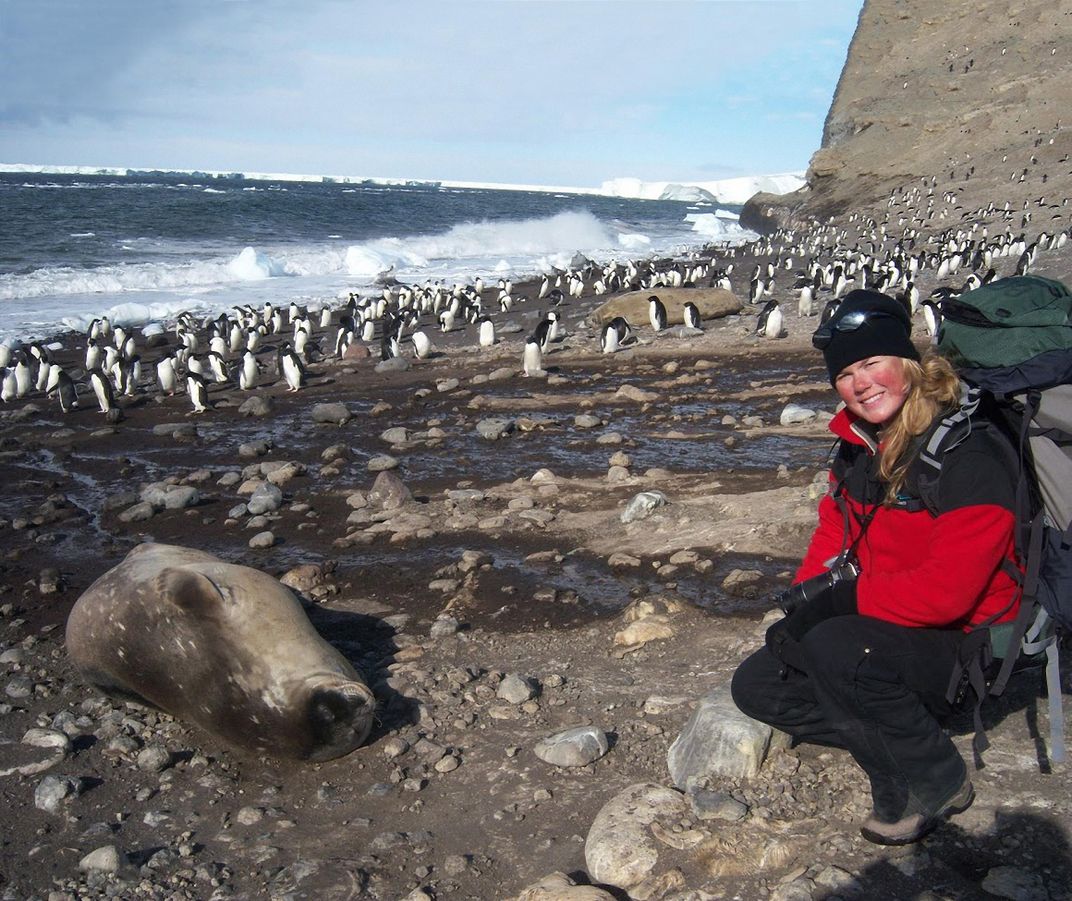
Penguins don’t travel the huge distances nighthawks do, but they can be just as difficult to study in person. Emperor penguins nest only on sea ice—thick ice that forms on open water—off the coast of Antarctica, and they rarely come onto land.
“If you wanted to fly a plane to a bunch of different colonies, it’s really difficult to do,” says Michelle LaRue. “You can’t necessarily land in many of these places.” The way she and her colleagues find penguin colonies is surprisingly simple: They search satellite pictures for poop. “If you see a big brown stain on the sea ice, that tells us there are Emperor penguins,” she says.
Whereas census-taking used to require expensive travel by ship or airplane, satellite imagery lets the researchers track penguin populations through their guano alone. The method isn’t free, though. LaRue and her colleagues use data from DigitalGlobe satellites, which give much more detail than Landsat—the resolution is as fine as 12 inches per pixel. This higher-resolution imagery costs more, as do storage and processing. For LaRue, the payoff is worth it.
“The paper my colleagues and I published in 2012 reported 46 colonies,” she says. “We just searched the rest of the coastline to see if we were missing any others. We almost doubled the number of [known] colonies just by using the combination of Landsat and the DigitalGlobe imagery.”
Under favorable conditions, the DigitalGlobe images can even show individual birds. Emperor penguins stand up to 130 centimeters (51 inches) tall, so they’re just large enough to be visible.
“That allows us to train the computer to differentiate the different pixels to say ‘Okay, this is a pixel of penguin, this is a pixel of guano, and this is a pixel of snow and ice,’ ” says LaRue. “You can convert that into the actual number of penguins that are there.”
Emperor penguins, like many bird species, have booms and bad years in terms of how many chicks survive to adulthood. The amount of sea ice also varies from year to year, even discounting the effects of climate change. And humans influence the penguin environment in other ways. “We have an impact in the Southern Ocean,” says LaRue. “We fish for krill and a few other key species of fish,” which effectively put humans and penguins in competition for the same food. Keeping track of penguin populations can tell the scientists a lot about the overall health of the Antarctic ecosystem.
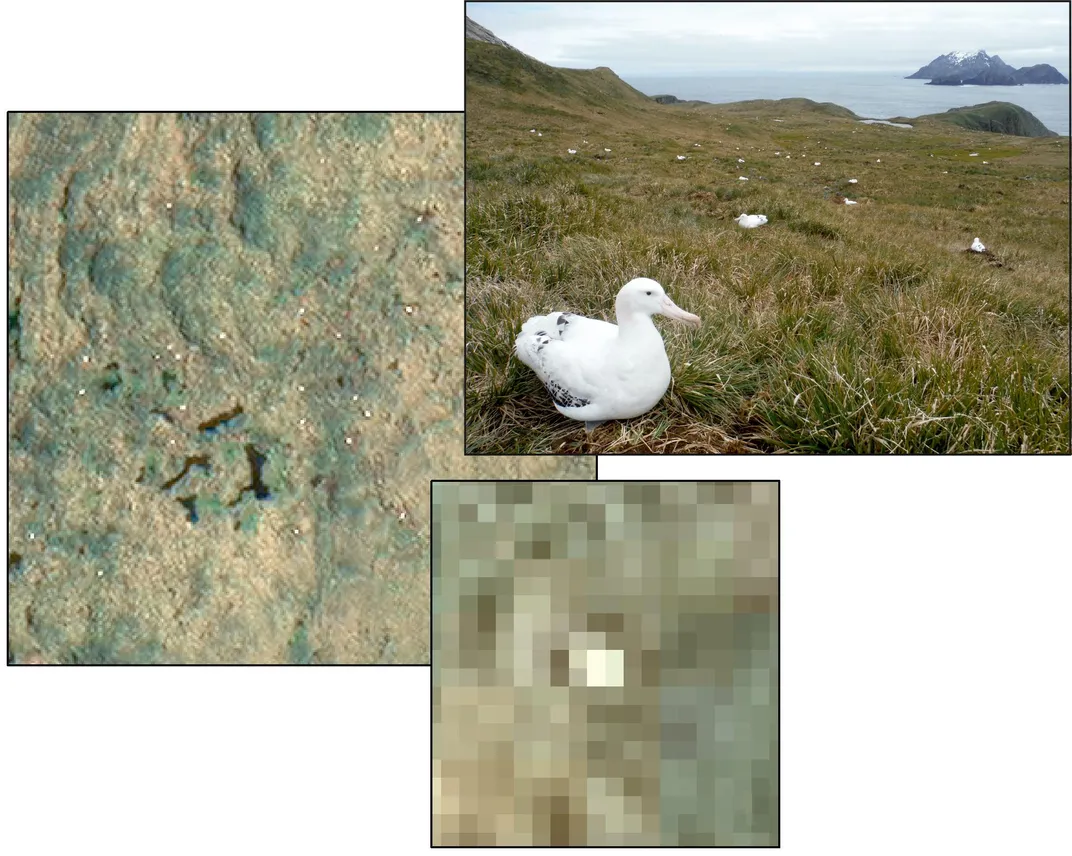
LaRue collaborated on the penguin census with Peter Fretwell of the British Antarctic Survey, who also tracks the health of other wildlife in areas around Antarctica and the Southern Ocean, many of which have no human inhabitants and little vegetation. Among the animals he studies are southern right whales and several species of albatross. DigitalGlobe images are useful for his work too. “[Great albatrosses] breed all around the Southern Ocean [in] extremely remote places,” he says. “Some of the islands are too far away to get a small plane to them. You need a boat with a helicopter on it, which is extremely expensive.” Satellite imagery is the solution. “We’ve just done a count of Annenkov Island in South Georgia, and that hasn’t been counted since 1986.”
Fretwell’s team took another census of northern royal albatrosses on the Chatham Islands, located east of New Zealand in the South Pacific. “It was the first time [the birds] had been counted for a number of years,” he says. “We found that on one island, the population was stable, but on the other islands it had gone down by some extent.”
Like penguins, albatrosses are big enough to be seen in the highest-resolution images. “It’s really important to be able to have a long-term monitoring approach and be able to survey them every year, but on the ground that’s just not possible,” says Fretwell. “The real advantage of these satellites is to do counts every season, possibly multiple times a season.”
Tiger land
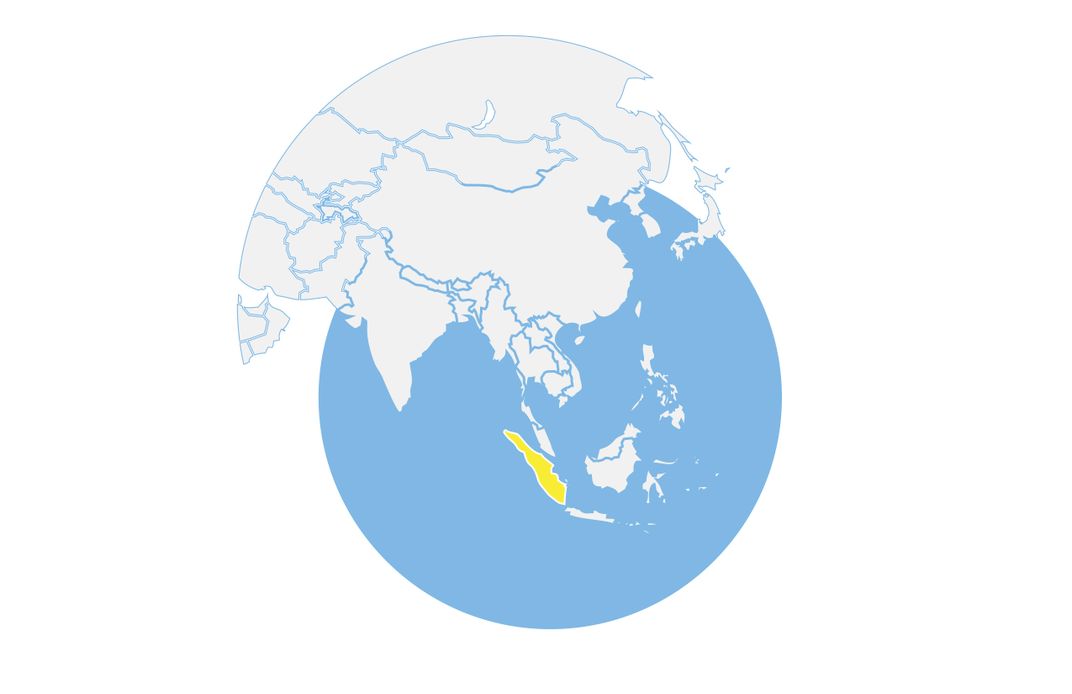
Most animals don’t live in open environments where dark spots are plainly visible against a white background. On the island of Sumatra, tigers live in forests, and the chances of a satellite catching one of these critically endangered cats out in the open are slim.
But it’s still possible to estimate their numbers by observing how their habitat is shrinking, as humans cut back forests for palm oil and acacia plantations.
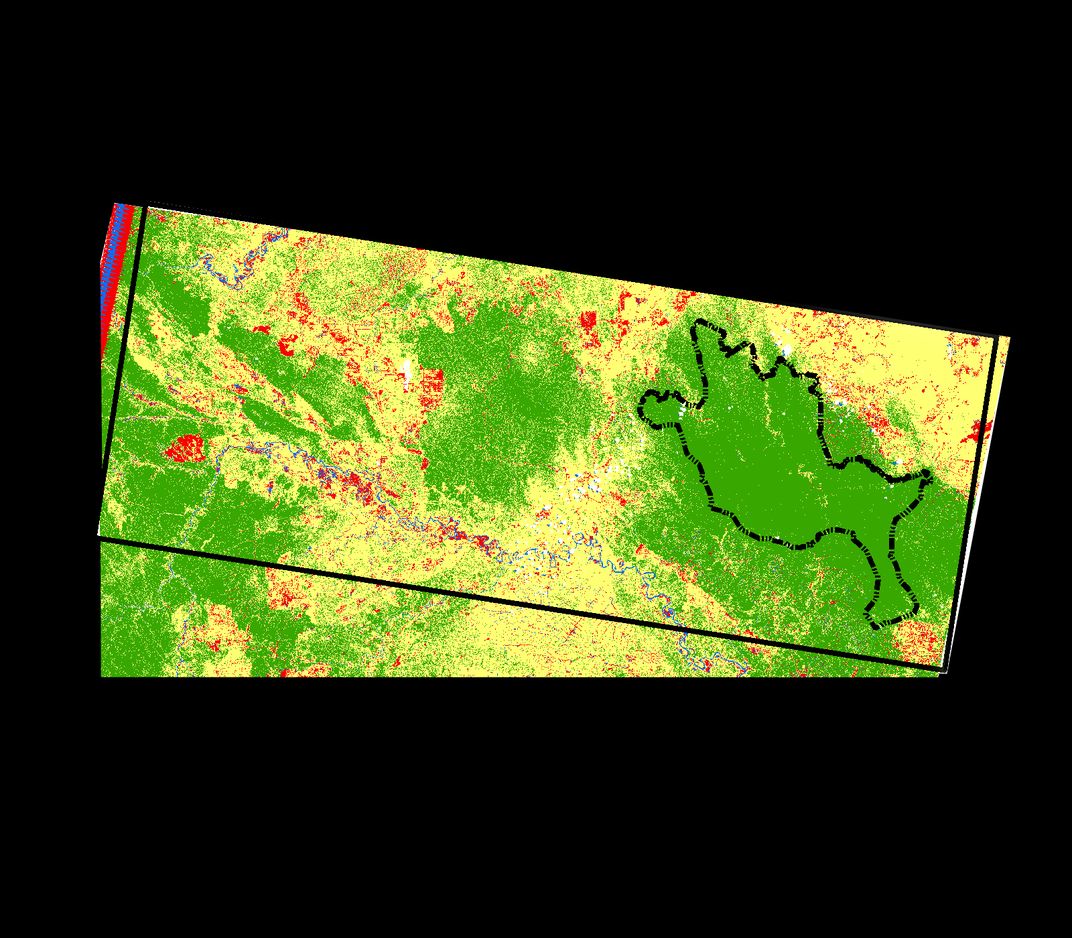
Erin Poor of Virginia Tech uses Landsat imagery to investigate how human activity affects tiger habitat. Because sustainable tiger populations need large amounts of unbroken natural forest, assessing how the forest is interrupted by farms and plantations can be more important than measuring its total extent.
“I’m looking at how forest has changed over time [from] 2002 to 2016,” Poor says. She starts by creating maps of Sumatra’s Riau Province from Landsat images that distinguish different types of plants by the ways they absorb and reflect various bands of visible and infrared light. “I’m not distinguishing between tiger habitat and plantation,” she says. “I’m really distinguishing between native forest and plantation, because acacia and oil palm trees have much different spectral signatures than native rainforest trees.”
Then she adds data on roads, elevations, slope, distance to cities, and other factors to produce “an actual habitat map for tigers, going further than just forest or non-forest.” The goal of this research is not just conservation but also minimizing conflicts between tigers and humans.
“Another benefit of using satellite imagery is it doesn’t require research permits to do work on the ground,” says Poor. The Indonesian government is concerned that this kind of research might lead to criticism of land management policies, especially where cash crops are grown. She hopes her habitat maps might help officials say, “These are the areas where you should focus your enforcement. These are the areas we think will be okay.”
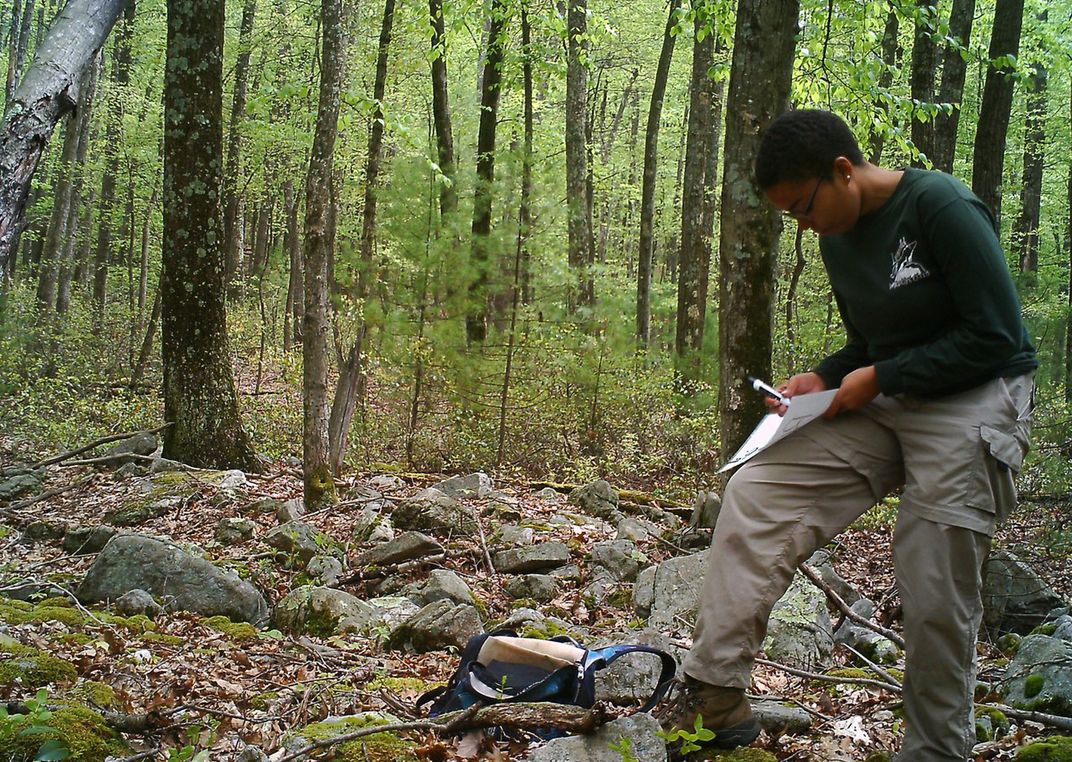
In a time when mapping has become integral to everyday life, from real-time traffic routing to finding a restaurant, not every project needs specialized satellite data. Wildlife researcher Asia Murphy of Penn State routinely uses Google Earth in her research. She has worked with the Wildlife Conservation Society in Madagascar to produce “the first solid scientific information about a suite of species,” from small mammals to ground-dwelling forest birds. Many of the species are unique to the island, including lemurs, cat-like predators known as fossa, and hedgehog-like tenrecs.
Murphy and her colleague, Zach Farris, used Google Earth to see how rapidly people have been cutting down forests in areas where scientists were surveying wildlife with trail cameras. To do that, she linked those pictures with satellite images of the same regions taken from 2008 through 2013. “We wanted to look at the difference between the forest cover when we first started our wildlife surveys versus the forest cover when we stopped,” says Murphy. “We found higher hunting and consumption rates by people in areas with higher carnivore presence.”
Murphy’s research, like Erin Poor’s, sometimes highlights conflicts between local commercial interests and scientists, many of whom live outside the countries they study. Remote sensing gives the researchers a kind of access to places they normally wouldn’t be allowed to visit, including war zones and countries hostile to foreign scientists.
“If you can’t study whales off North Korea, then you may be able to do that by satellite,” says Peter Fretwell. “If you can’t go to South Sudan and count the migration of the antelopes—because it’s a war zone—you could do that by satellite. Strangely enough, those areas [of conflict] are also some of the areas where we’ve got the most satellite imagery.”
The importance of that data will only increase with continued human impact on the environment. Luckily, remote sensing technology is improving just as rapidly, with new sensors and analytical tools that help scientists understand how the world is changing for every living thing, from aardvarks to zebras.

Subscribe to Air & Space Magazine Now
This story is a selection from the April/May issue of Air & Space magazine